
Table of Contents
Executive Summary
The US-Israeli military campaign against Iran, launched February 28, 2026, has created an energy-supply shock with stagflationary implications not seen since the 1970s. The Strait of Hormuz — conduit for ~20% of global oil and 30% of LNG — faces its most significant disruption in modern history, while actual attacks on physical LNG infrastructure mark a structural shift beyond mere transit risk.
Key Quantitative Findings
- Oil prices have risen ~14% to ~$80/bbl embedding a $14/bbl geopolitical risk premium (Goldman Sachs, March 2026) [6]
- IMF projects global growth slipping to 2.5% (adverse scenario) vs. 3.1% baseline — a ~0.6pp drag [4]
- World Bank estimates inflation could spike 200–300 bps under a prolonged conflict scenario [WorldBank]
- Qatar's Ras Laffan LNG facility attack damaged 11% of global urea export capacity (Adam Tooze, Chartbook 436) [2]
- Israel's war costs estimated at $66B (~12% of GDP), creating sovereign credit pressure (Moody's) [2]
- Goldman Sachs and UBS warn: if disruption extends through Q2 2026, global headline inflation rises +0.7–0.8pp [6]
- FRED data confirms WTI crude averaged $72/bbl YTD 2026, up from $65.5/bbl full-year 2025
2. Expert Perspectives
Academic Economists
Jeffrey D. Sachs — Columbia University
Sachs argues that the US-Israel actions represent a deliberate pursuit of regional hegemony — combining Israeli territorial expansion with American-backed regime change — rather than a defensive operation. The economic consequences are "already severe and could become catastrophic." He specifically highlights that the Strait of Hormuz carries approximately one-fifth of all globally traded oil and 30% of the world's LNG, and that a sustained closure "would trigger an energy shock without modern precedent." [1]
"The conflict is likely to spiral out of control because the US and Israel are dead set on hegemony in the Arab world and West Asia." — Jeffrey D. Sachs, March 2026 [1]
Adam Tooze — Columbia University (Chartbook)
Tooze frames the current crisis as fundamentally different from past oil-transit disruptions in that actual physical infrastructure has been destroyed. The Israeli attack on Iran's gas infrastructure, followed by Iran's retaliatory strike on Qatar's Ras Laffan LNG complex (the world's largest), marks a structural inflection point. Tooze also identifies an underappreciated agricultural supply shock: Qatar accounts for 11% of global urea exports and Iran 10–12%, meaning the conflict is materializing as a global food-inflation catalyst, not merely an energy shock. [2]
"There's just the dawning realization that even if this war in some way can be brought to a cease-fire, the entire region will never be the same again." — Adam Tooze, Foreign Policy, March 2026 [2]
Industry Economists
Nouriel Roubini — Atlas Capital / Former White House Economist
Roubini assigns a greater than 50% probability to US escalation, characterizing the most likely scenario as the US and Israel choosing to press for a decisive military outcome rather than de-escalate. In the best-case scenario, this produces "global economic turmoil in the short run followed by greater global stability." Severe damage to Gulf oil infrastructure would produce major stagflationary pressure across global equities, bond yields, and credit spreads — a 1970s-style disruption compounded by already-elevated debt levels. [3]
Pierre-Olivier Gourinchas — IMF Chief Economist
Gourinchas testified that the world "may already be drifting toward the IMF's adverse scenario" of 2.5% global growth. Even if the Strait of Hormuz were to reopen immediately, an oil shortfall for the full year 2026 is already locked in. The IMF characterizes this as a potential "energy crisis on an unprecedented scale" that could tip the world into a global recession. [4]
Jahangir Aziz — JPMorgan Global Co-Head of Economic Research
Aziz offers the most constructive near-term view: structural oversupply in the oil market provides a meaningful buffer. Unless critical infrastructure is permanently destroyed or the Strait faces a sustained multi-month disruption, the global shock should remain regional. He identifies oil as the single primary transmission channel and argues that current market pricing reflects a "relatively short event or regional conflict." [5]
3. Market Intelligence
Goldman Sachs
Goldman Sachs Research estimates that traders are demanding approximately $14/bbl more for crude than before the conflict. This risk premium roughly corresponds to the estimated effect of a full four-week halt in Strait of Hormuz flows (with spare pipeline capacity used as a partial offset). Their commodities team forecast: oil rises modestly further before moderating to $76/bbl on average in Q2 2026 and $65/bbl by Q4 2026, contingent on a structurally oversupplied global market absorbing the disruption. Tighter financial conditions — already 31 bps since February 28 — could lower global GDP growth by an additional 0.3pp. [6]
JPMorgan Asset Management
JPMorgan models two scenarios. In its central scenario (contained disruption), the impact on US inflation and growth is negligible and three Fed rate cuts remain intact. In its severe scenario (full Strait closure), year-end inflation in the UK and Eurozone rises by approximately 2 percentage points, driven by energy prices, with knock-on effects to core prices and food inflation. GCC non-oil growth forecasts have been trimmed by 0.3–0.5pp across the Gulf bloc. [5]
Lombard Odier
Lombard Odier's quantitative modeling confirms the contained-scenario/severe-scenario framework. In their base case, US headline inflation rises only 0.1pp to 2.6% and Fed rate cut trajectory is preserved. Europe faces headline inflation edging toward 2.0% — a level the ECB can hold through. Across developing Asia and EMEA emerging markets, a 20bp inflation increase and 20bp growth decrease is the contained-scenario estimate, with significant country-by-country divergence in the severe scenario. [7]
World Bank
World Bank President Ajay Banga characterized the conflict as having a "cascading impact" on the global economy. Even under a baseline with an early ceasefire, global growth could be lowered by 0.3–0.4pp and inflation could rise 200–300bps. Under a prolonged war scenario, growth could be reduced by up to 1.0pp and inflation could spike by up to 0.9pp. [WorldBank]
4. Historical Context
Three historical episodes provide essential analytical benchmarks for evaluating current risks. Each was precipitated by Middle East conflict in which US and/or Israeli actions played a catalytic role, and each produced a characteristic sequence — energy shock, inflation, monetary tightening, recession.
| Episode | Oil Price Change | US CPI Peak | US GDP Impact | Duration |
|---|---|---|---|---|
| 1973 Arab Oil Embargo | +300% | 12.3% (1974) | −0.5% (1974) | ~5 months |
| 1979 Iranian Revolution | +130% | 13.5% (1980) | −1.9% (1982) | ~2 years |
| 1990 Gulf War | +100% | 6.3% (1990) | −0.1% (1991) | ~9 months |
| 2003 Iraq War | +20% | 2.3% (2003) | +2.8% (2003) | Limited shock |
| 2026 US-Israel-Iran (Ongoing) | +14% (YTD) | 2.7% YTD + risk | TBD (−0.3–1.0pp risk) | Ongoing |
Sources: FRED WTISPLC, CPIAUCSL, GDPC1 [11]; Wikipedia 1973 Oil Crisis [8]; BIS Working Paper [10].
5. Data Analysis
The following charts are constructed from authoritative primary data retrieved via the FRED API (Federal Reserve Economic Data, St. Louis Fed) and the OECD national accounts database. All series cover 2000–2026 to capture three distinct geopolitical shock cycles alongside the current escalation.
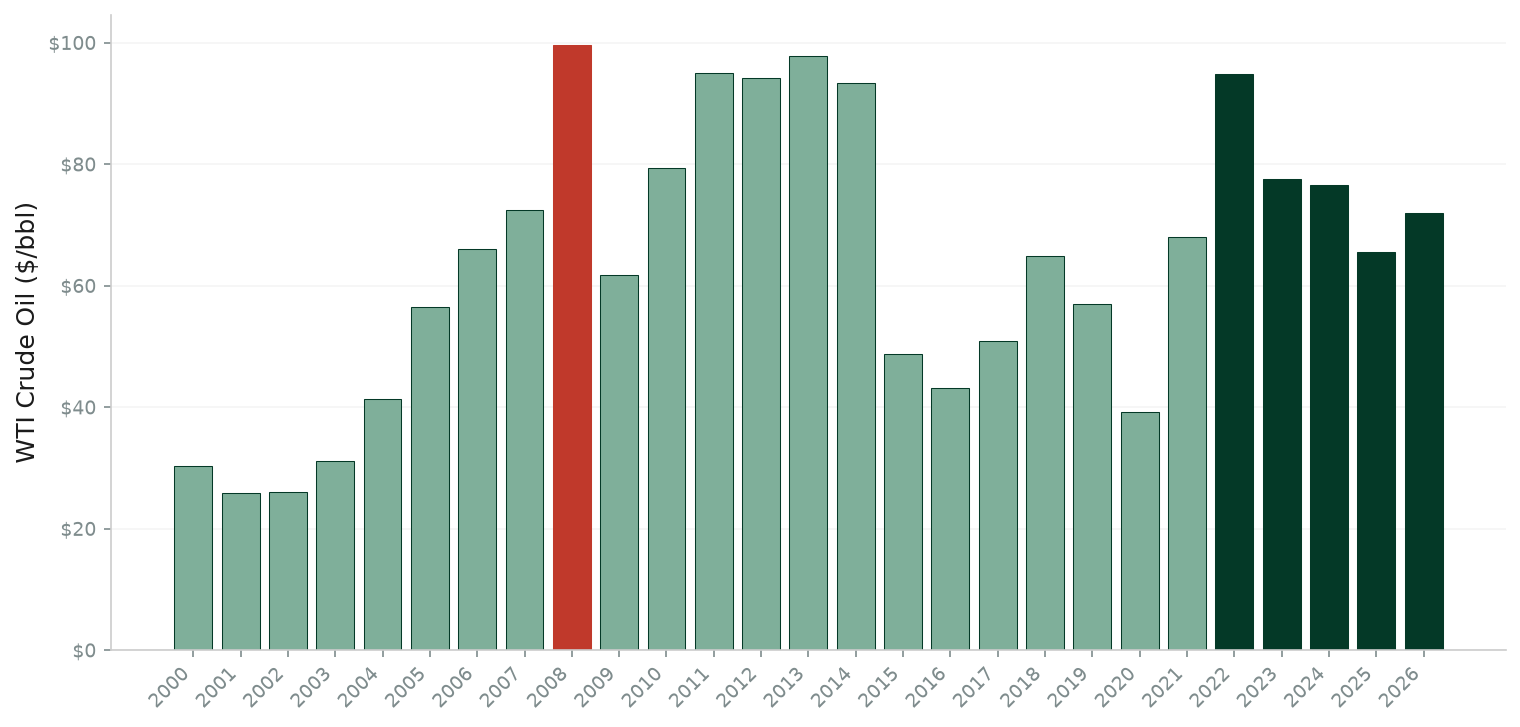
Shaded period annotations denote major Middle East conflict episodes.
Key Data Observations
- Energy Prices (Figure 1): WTI crude averaged $72/bbl YTD 2026, up from $65.5 (2025 full-year), reflecting an embedded risk premium after the February 28 strikes. Structural oversupply (vs. the 1970s/1980s tight market) has so far limited the spike relative to historical precedents — but infrastructure damage is a game-changer.
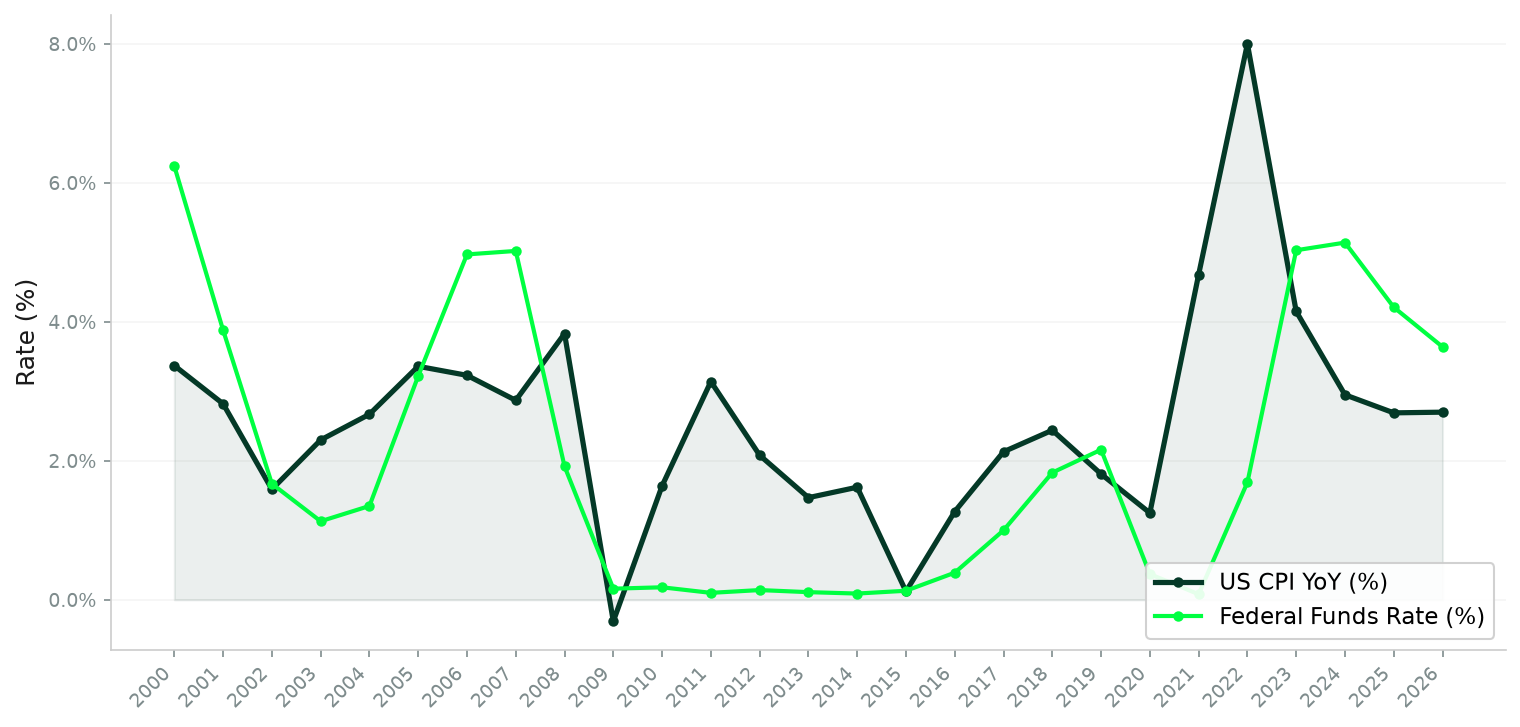
- Inflation (Figure 2): US CPI averaged 2.7% YTD 2026 — a modest reacceleration after 2.95% in 2024 and 2.69% in 2025. The risk premium in energy is beginning to pass through to headline inflation; the path to a more severe 1973-style outcome depends entirely on the duration of infrastructure disruption.
- Federal Funds Rate (Figure 2): The Fed Funds rate has declined from its 5.14% 2024 peak to 3.64% YTD 2026, reflecting the Fed's cautious easing cycle. A sustained energy shock would force a reversal of this easing trajectory — a significant headwind for risk assets.
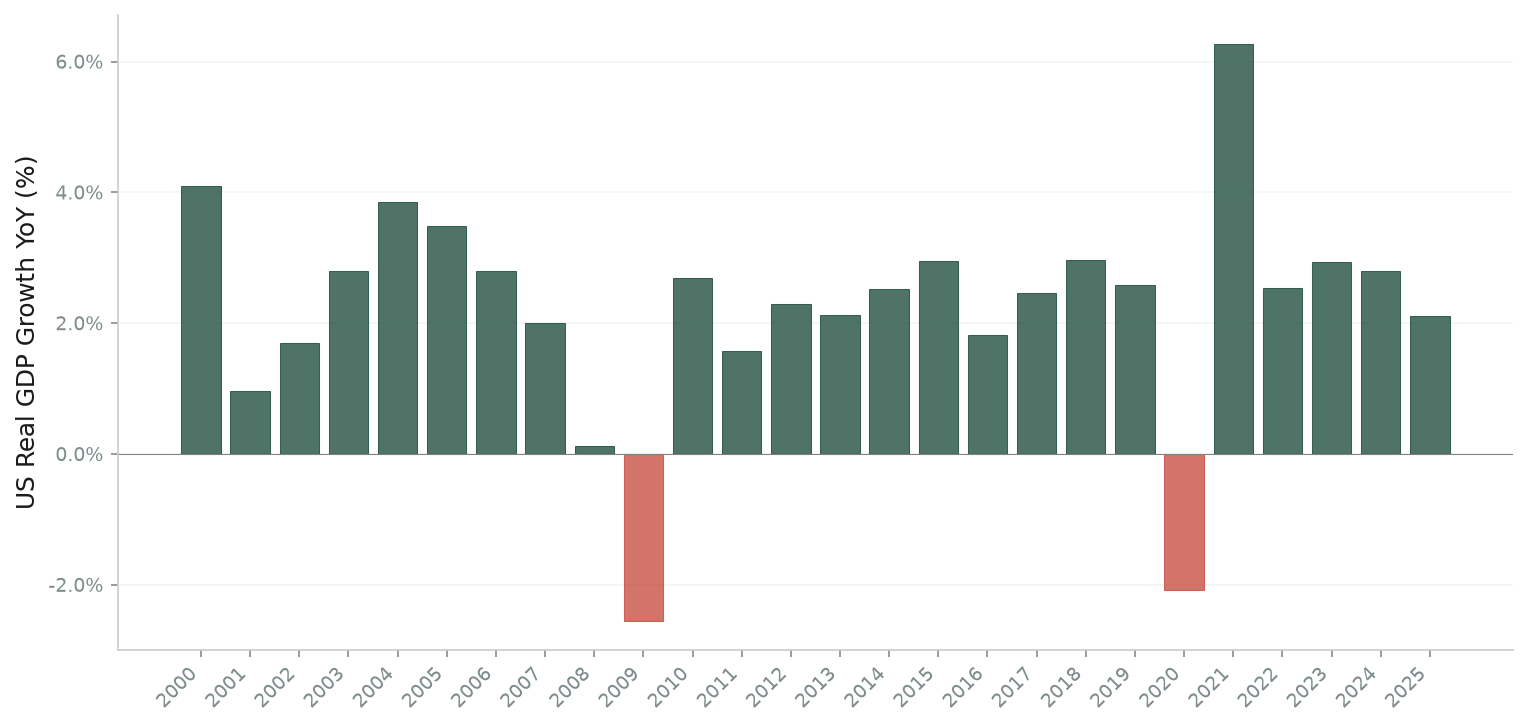
- GDP Growth (Figure 3): US GDP growth has moderated to 2.11% in 2025 from 2.80% in 2024. The IMF's adverse scenario projects further deceleration toward 2.5% globally, with more severe impacts for energy-importing economies.
6. Impact Analysis
6.1 Macroeconomic Implications
Inflation Dynamics
A sustained disruption to the Strait of Hormuz adds an estimated 0.7–2.0 percentage points to global headline inflation, depending on severity. Energy prices are the direct channel, but fertilizer and agricultural supply disruptions introduce a second inflationary wave — food prices — that is more persistent and regressive. Central banks globally will face pressure to delay or reverse rate cuts, tightening financial conditions at a time when debt servicing costs are already elevated.
Growth & Stagflation Risk
The global supply-demand imbalance driven by energy disruption — higher costs, lower output — is a textbook stagflation setup. Historical analysis of the 1973 and 1979 episodes confirms that once energy-shock inflation becomes embedded, central bank responses create their own growth drag. The IMF's adverse scenario of 2.5% global growth represents a ~0.6pp drag from baseline, but infrastructure damage scenarios (which the IMF's "energy crisis of unprecedented scale" language references) carry risks beyond this range.
6.2 Sector-Specific Implications
| Sector | Direction | Key Driver | Magnitude | Duration |
|---|---|---|---|---|
| Energy (O&G Producers) | ▲ Positive | Risk premium; elevated oil/gas prices | High | Medium-term |
| Defense & Aerospace | ▲ Positive | Geopolitical instability; munitions restocking | High | Long-term structural |
| Shipping & Freight | ▲ Mixed | Higher freight rates; rerouting premiums | Moderate–High | Medium-term |
| Agriculture / Fertilizers | ▼ Disrupted | Qatar/Iran urea supply (~20–23% of global) | High | Near–Medium-term |
| Consumer Discretionary | ▼ Negative | Disposable income squeeze; energy/food costs | Moderate | Concurrent with conflict |
| Airlines & Tourism | ▼ Negative | Jet fuel costs; Gulf air corridor closure | Moderate–High | Near-term |
| Emerging Market Sovereigns | ▼ Negative | Energy import costs; tighter USD conditions | High (energy importers) | Concurrent with conflict |
| LNG Utilities & RE | ▲ Mixed/Positive | Accelerated energy transition premium | Moderate | Long-term structural |
| Gold & Safe Havens | ▲ Positive | Geopolitical uncertainty premium | High (near-term) | Near-term |
6.3 Regional & Country-Level Divergence
The impact is highly asymmetric across geographies. The United States has the greatest buffer: domestic shale production provides a degree of energy independence and the US economy has transitioned away from oil intensity. Europe, however, is significantly more exposed given residual LNG import dependency, proximity to supply routes, and pre-existing energy market fragility post-Russia/Ukraine. Asian economies — Japan, South Korea, India, and China — remain the most vulnerably exposed as large energy importers. Gulf Cooperation Council (GCC) non-oil GDP growth has already been trimmed by JPMorgan by 0.3–0.5pp, and the risk of a wider regional economic contraction is elevated.
6.4 Financial Markets Implications
Goldman Sachs notes that financial conditions have already tightened by 31bp since February 28, 2026. If sustained, this tightening alone can lower global GDP growth by an additional 0.3pp. Equity markets have exhibited high volatility as investors price in conflicting signals. In historical oil shocks, equity markets experienced sustained drawdowns when the inflationary impulse forced central bank tightening. Credit spreads in energy-importing emerging markets have widened, and sovereign yield premiums are repricing. Gold and commodity-linked assets have outperformed, consistent with historical geopolitical risk-premium dynamics.
7. Risk Assessment
Quantitative scenario analysis across geopolitical, energy, financial, and macroeconomic dimensions yields an aggregate HIGH risk rating for portfolios with material exposure to energy-intensive or Middle East-linked sectors.
| Risk Category | Severity | Portfolio Impact | Key Driver | Monitoring Trigger |
|---|---|---|---|---|
| Energy Supply Shock | High | Inflation; rates; equities | Strait of Hormuz closure duration | Oil > $100/bbl sustained |
| Infrastructure Damage (LNG) | High | Energy prices; industrial costs | Qatar Ras Laffan repair timeline | LNG spot price escalation |
| Stagflation / Monetary Reversal | High | Duration assets; growth equities | Energy pass-through to CPI core | CPI re-acceleration > 3.5% US |
| Agricultural / Food Inflation | Moderate–High | EM sovereign credit; consumer firms | Fertilizer supply disruption (urea) | Urea price index +$100/MT |
| Conflict Escalation / Wider War | High | All risk assets | Roubini: >50% probability of escalation | Saudi Aramco / UAE attacks |
| EM Sovereign Contagion | Moderate | EM fixed income; FX | USD strength; oil import bills | EM credit spread index > 500bp |
| US-China Realignment | Moderate | Trade flows; tech sector | China perceived opportunity in US isolation | China-Iran-Russia coordination signals |
| Global Recession | Moderate | Cyclical assets broadly | IMF adverse scenario materialization | Global PMIs below 48 sustained |
8. Outlook & Scenarios for 2026–2028
Contained Escalation
Probability: ~40%
Ceasefire reached within 4–6 weeks. Strait of Hormuz partially/fully reopened.
Oil Impact: Fades to $65–70/bbl by Q4 2026
US Inflation: +0.1pp to 2.6%
Global Growth: ~3.0% (near baseline)
Fed Policy: 3 rate cuts intact
Markets: Risk-on recovery; energy sector pullback
Prolonged Disruption
Probability: ~40%
Conflict extends 3–6 months. Infrastructure partially damaged; Strait intermittently open.
Oil Impact: $90–110/bbl sustained
US Inflation: +0.5–0.8pp to 3.2–3.5%
Global Growth: 2.5–2.7% (IMF adverse scenario)
Fed Policy: Rate cuts paused or reversed
Markets: Volatility; EM pressure; gold outperforms
Major Infrastructure Crisis
Probability: ~20%
Multi-month Strait closure. Critical Saudi/UAE infrastructure struck. Permanent LNG capacity loss.
Oil Impact: >$150/bbl; $200 possible
US Inflation: +1.5–2.0pp; stagflation risk
Global Growth: Below 2.0%; recession risk
Fed Policy: Forced tightening despite slowing growth
Markets: Broad sell-off; 1970s analog
Implications for Asset Allocation
Across all three scenarios, the structural outperformers are energy producers, defense contractors, and hard assets (gold, commodities). The underperformers are consumer discretionary, airlines, highly leveraged corporates, and energy-importing emerging market sovereigns. The conviction trade in Scenarios B and C is a re-steepening of inflation expectations — positioning for premium in TIPS, commodity-linked equities, and energy infrastructure becomes more attractive. Duration assets (long bonds) face the most asymmetric downside in Scenarios B and C as monetary policy is forced toward tightening even as growth decelerates.
For the 2–3 year horizon, the structural geopolitical realignment underway — with middle powers reassessing reliance on US-led institutions and energy security becoming a sovereign priority — argues for overweighting diversified energy infrastructure and defense globally. The acceleration of the energy transition, paradoxically catalyzed by the conflict, creates long-term structural tailwinds for renewable energy and battery storage, even if the near-term energy-price environment favors fossil fuels.
9. References
[1] J. D. Sachs, "Ending the Trump-Netanyahu War in the Middle East," JeffreySachs.org, Mar. 16, 2026.
[2] A. Tooze, "Chartbook 436 Unseasonal war: How the US-Israeli war on Iran threatens the global agricultural cycle," Chartbook / Substack, Mar. 4, 2026; and "Chartbook 321 Ruination, trade interruption and downgrades," Sep. 28, 2024.
[3] N. Roubini, "US Escalation Is the Most Likely Scenario in Iran," NourielRoubini.com, Mar. 28, 2026; Bloomberg interview on Lake Como, Mar. 27, 2026.
[4] Reuters / IMF, "IMF says world is drifting toward more adverse growth scenario as energy disruptions continue," Apr. 14, 2026; CNN Business, "IMF sees global oil shortfall this year and warns Iran war could tip world into recession," Apr. 15, 2026.
[5] J. Aziz (JPMorgan), "Middle East conflict unlikely to trigger global economic shock," The Business Times, Mar. 3, 2026; JPMorgan Asset Management, "Navigating the impact of the Middle East conflict," Apr. 17, 2026; Reuters, "JPMorgan trims GCC non-oil growth forecasts," Mar. 2, 2026.
[6] Goldman Sachs Research, "How Will the Iran Conflict Impact Oil Prices?" Mar. 3, 2026; Goldman Sachs, "Global Economic Impacts of the War in Iran," GSPublishing, Mar. 5, 2026; Goldman Sachs Asset Management, "Market Brief: Investment Perspectives on the Middle East Conflict," Mar. 3, 2026.
[7] Lombard Odier, "US-Israel-Iran conflict: macroeconomic and investment scenarios," Mar. 11, 2026; "Middle East conflict | Regional economic impacts of two oil price scenarios," Mar. 11, 2026.
[8] Market Histories, "The Yom Kippur War and the Oil Shock: How a Middle East Conflict Reshaped Global Finance (1973)," Mar. 26, 2026; The Conversation, "Rising oil prices, surging inflation: The Arab embargo 50 years ago weaponized oil," Oct. 11, 2023.
[9] Middle East Institute, "The 1979 Oil Shock: Legacy, Lessons and Lasting Reverberations," 2009; Cambridge University Press, "Inflation and Energy Price Shocks: Lessons from the 1970s," Oct. 2025.
[10] Bank for International Settlements, "Aggregate demand, uncertainty and oil prices: the 1990 oil shock in comparative perspective," BIS Economic Paper No. 31, 1993.
[11] Federal Reserve Economic Data (FRED), Federal Reserve Bank of St. Louis. Series retrieved: WTISPLC (WTI Crude Oil, Monthly), CPIAUCSL (CPI, YoY %, Monthly), DFF (Federal Funds Effective Rate, Monthly), GDPC1 (Real GDP, % change YoY, Quarterly). Date range: 1990-01-01 to 2026-04-01.
[12] OECD, "National Accounts at a Glance," Dataset: DSD_NAAG@DF_NAAG_I, Measure: Real gross domestic product growth rate (annual). Countries: USA, GBR, DEU, JPN, AUS. Date range: 1990–2026.
[13] NIESR, "How Might a Wider Middle East Conflict Affect the Global Economy?" Oct. 31, 2024.
[WorldBank] Ajay Banga (World Bank President), interview, Reuters, Apr. 10, 2026.
[IMF-FS] IMF, "War in the Middle East Challenges Global Financial Stability," IMF Blog, Apr. 14, 2026.
[FP] J. Hamilton, "Historical Oil Shocks," NBER Working Paper 16790, 2011.
Important Disclosures & Disclaimers
This research memorandum is provided for informational purposes only and does not constitute investment advice, an offer to sell, or a solicitation to buy any securities. The analysis and views expressed herein are based on publicly available information, proprietary AI-driven quantitative models, and third-party data sources which SkyWise Wealth believes to be reliable but does not independently verify. SkyWise Wealth makes no representations as to the accuracy or completeness of such information.
Past performance is not indicative of future results. All investments involve risk, including possible loss of principal. The securities, sectors, and geographies discussed may not be suitable for all investors. This report is intended solely for institutional and professionally qualified investors. Recipients should conduct independent due diligence and consult with qualified financial advisors before making investment decisions.
Analyst Certification: The research analysts responsible for this report certify that the views expressed herein accurately reflect their professional views. SkyWise Wealth and its affiliates may hold positions in instruments referenced in this report.
Frequently Asked Questions
How do Middle East geopolitical events affect global markets?
Middle East geopolitical events impact global markets through oil price volatility, supply chain disruptions, risk premium adjustments, and capital flow shifts. Events involving US and Israeli actions can trigger immediate market reactions across equities, commodities, and currencies.
What are the economic reverberations of US and Israeli actions in the Middle East?
US and Israeli actions in the Middle East create economic reverberations through oil market disruptions, regional trade changes, investor risk sentiment shifts, and potential sanctions impacts. These effects ripple through global supply chains and financial markets.
How should institutional investors assess Middle East geopolitical risk?
Institutional investors should use quantitative analysis to assess Middle East geopolitical risk, including monitoring oil price sensitivity, tracking regional conflict indicators, stress-testing portfolios for supply chain disruptions, and maintaining appropriate hedging strategies.
Published Apr 29, 2026 and not updated since. Personal views, not investment advice. See Disclosures.