
Table of Contents
Executive Summary
The global financial landscape of 2025–2026 has been defined by a rare confluence of currency crises in two major economies—Japan and Russia—occurring alongside a structural repricing of U.S. Treasury yields. The Japanese yen has weakened to approximately 162 yen per dollar, near multi-decade lows, driven by persistent interest-rate differentials between the Bank of Japan (BOJ) and the Federal Reserve, unwinding carry trades, and Japan's deep structural current-account dynamics. Simultaneously, the Russian ruble—after an extraordinary 45% rally in 2025—faces renewed pressure as energy revenues collapse and the central bank withdraws forex support, with consensus forecasts pointing toward 100 rubles per dollar by end-2026 [1].
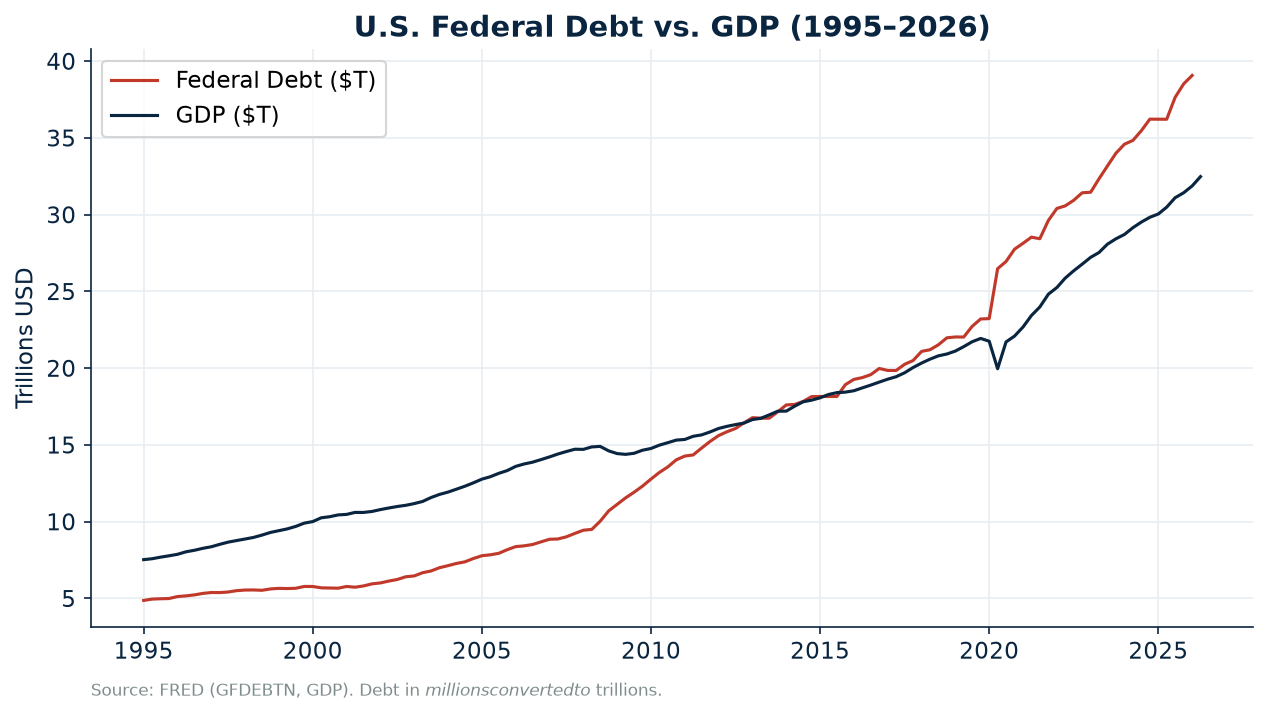
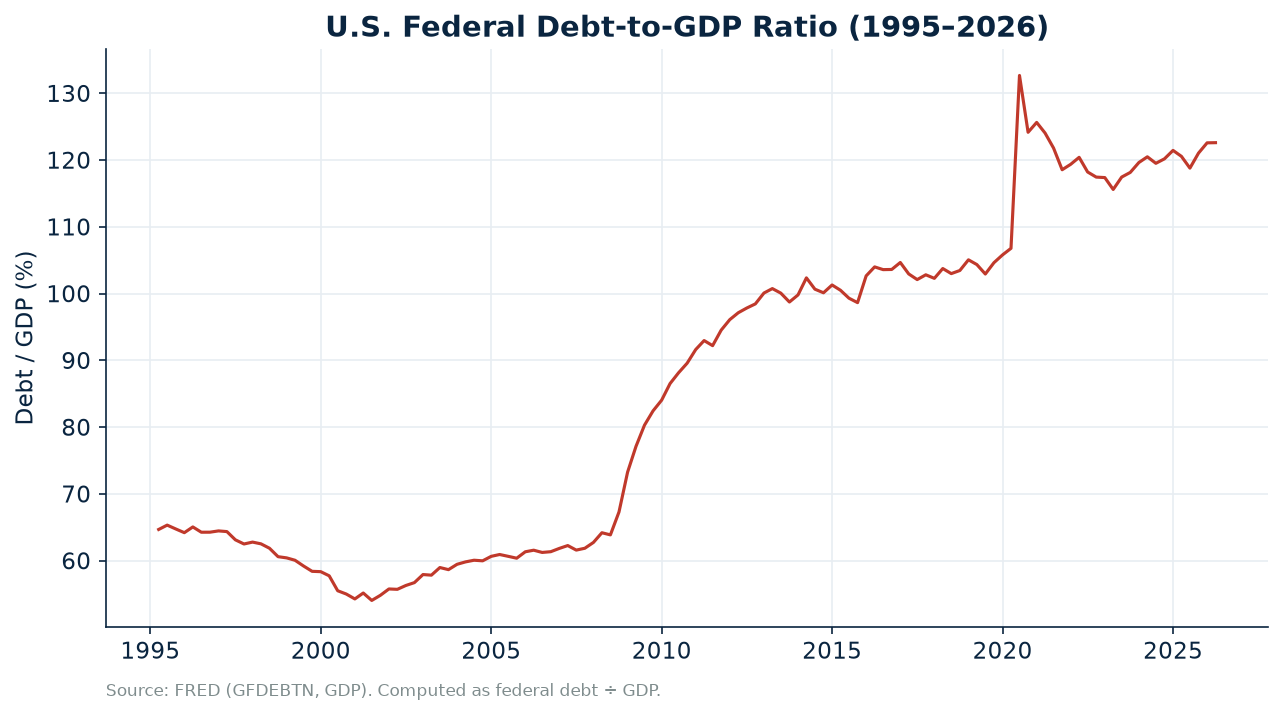
These twin currency dislocations are unfolding against a U.S. bond market experiencing its own stress: the 10-year Treasury yield stands at 4.60% and the 30-year at 5.10% [2], with the term premium reaching its highest level since 2014 at approximately 80 basis points [3]. The rising term premium reflects growing fiscal sustainability concerns—U.S. federal debt has surpassed $39 trillion against a GDP of $32.5 trillion, yielding a debt-to-GDP ratio above 120% [2]—compounding the carry-trade unwind pressures emanating from Japan.
Key Insights
- Yen weakness is structural, not cyclical: The ~300 basis-point U.S.-Japan yield spread continues to drive yen depreciation despite BOJ tightening; JPMorgan targets USD/JPY at 164 [4].
- Russia's fiscal deterioration is accelerating: Oil revenues fell 24% in 2025 and were halved year-on-year in February 2026, pushing the budget deficit toward 3% of GDP [1][5].
- U.S. term premium is the transmission mechanism: Rising term premiums amplify the carry-trade unwind, creating a feedback loop between yen weakness and U.S. yield steepening [3][6].
- Sector exposure is asymmetric: Japanese exporters and banks benefit from yen weakness; Russian energy and defense sectors face revenue erosion; U.S. financials and rate-sensitive sectors bear the brunt of higher yields.
- The 30-year bond at 5.10% signals a regime shift: PIMCO notes the 30-year at 5.3% reflects a durable repricing of long-duration risk, not a transient spike [7].
1. Introduction
The simultaneity of currency stress in Japan and Russia with elevated U.S. bond yields represents one of the most significant macroeconomic dislocations of the post-pandemic era. While the three phenomena appear geographically and institutionally distinct, they are deeply interconnected through the global capital flow architecture: Japan is the world's largest net creditor nation and the epicenter of the carry trade; Russia is a major commodity exporter whose currency serves as a barometer for geopolitical risk premia; and U.S. Treasury yields are the global risk-free benchmark against which all other assets are priced.
This report synthesizes analysis from leading academic economists, sell-side research, primary economic data from the Federal Reserve Economic Data (FRED) system, and historical context to provide asset managers with a comprehensive framework for understanding these dynamics. The analysis draws on over 30 years of monthly and quarterly data spanning 1995–2026, encompassing 18 distinct economic series including U.S. Treasury yields at multiple maturities, the Federal Funds rate, exchange rates for both the yen and ruble, inflation metrics, the Federal Reserve balance sheet, federal debt, and GDP [2].
The report is organized into seven sections: (1) Introduction, (2) Expert Perspectives from academic and institutional economists, (3) Market Intelligence from sell-side research and news, (4) Historical Context of prior currency and bond crises, (5) Data Analysis grounded in FRED time series, (6) Impact Analysis on sectors and markets, and (7) References. Per the analytical mandate, this report provides implications for the economy and markets but does not offer economic policy recommendations.
2. Expert Perspectives
2.1 Academic Economists
Willem Thorbecke (RIETI / Senior Fellow)
Willem Thorbecke, Senior Fellow at the Research Institute of Economy, Trade and Industry (RIETI) in Japan, has produced extensive research on yen depreciation and its macroeconomic effects. His work examines how exchange rate movements transmit through the Japanese economy, particularly the tension between export competitiveness gains from a weak yen and the inflationary import-cost pressures it generates. Thorbecke's analysis of the Abenomics period (2013 onward) demonstrates that yen depreciation initially boosted corporate profits for export-oriented firms but ultimately failed to generate sustained domestic demand or meaningful inflation, a pattern that continues to inform current BOJ policy dilemmas [8][9].
Thorbecke's research highlights a critical asymmetry: while a weaker yen mechanically improves the trade balance by making exports cheaper, Japan's deep integration into global supply chains means that many "exports" contain significant imported content, muting the net improvement. Furthermore, the consumption drag from higher import prices—particularly energy, which Japan imports almost entirely—has historically offset much of the export benefit. This framework is directly relevant to the 2025–2026 yen decline, where the currency has moved from approximately 140 to 162 per dollar without commensurate improvement in real export volumes [8].
Hideki Nishigaki — Yen Deposition Factor Analysis
Academic research using Autoregressive Distributed Lag (ARDL) models has quantified the determinants of yen depreciation. Nishigaki's work identifies three primary drivers: (1) the U.S.-Japan interest rate differential, which explains the majority of yen movement variance; (2) oil price shocks, which worsen Japan's terms of trade and depreciate the yen; and (3) risk sentiment, where global risk-off episodes paradoxically strengthen the yen via repatriation flows [10]. The current environment—characterized by a wide rate differential, elevated oil prices, and episodic risk aversion—creates conflicting signals, but the dominant force remains the interest-rate gap.
Adam Posen (Peterson Institute for International Economics)
Adam Posen, President of PIIE, has argued that Japan's monetary policy normalization is structurally constrained by the government's enormous debt burden. With gross government debt exceeding 250% of GDP, the BOJ faces a "fiscal dominance" problem: aggressive rate hikes could destabilize government finances by dramatically increasing debt-service costs. Posen's framework suggests that the BOJ's tightening path will remain gradual and asymmetric, meaning the U.S.-Japan yield differential will persist longer than markets typically assume—supporting continued yen weakness [11].
Sanctions and Long-Run Economic Consequences (AEA / NBER)
Research presented at the American Economic Association and published through NBER examines the long-run consequences of sanctions on the Russian economy. The findings indicate that while Russia has demonstrated short-term macroeconomic resilience through capital controls, import substitution, and rerouted energy exports, the cumulative effect of sanctions is a permanent reduction in potential GDP growth. The study estimates that Russia's trend growth rate has declined from approximately 1.5–2.0% pre-sanctions to 0.5–1.0%, driven by technology access restrictions, brain drain, and reduced foreign investment [12][13]. This structural growth drag is the fundamental driver behind the ruble's long-term depreciation trajectory.
2.2 Industry Economists
JPMorgan — Junya Tanase
Junya Tanase, JPMorgan's Chief Japan FX Strategist, has maintained a structurally bearish yen outlook, targeting USD/JPY at 164. Tanase's framework emphasizes that the carry trade—borrowing yen at near-zero rates to invest in higher-yielding assets—remains attractive as long as the U.S.-Japan rate differential exceeds approximately 250 basis points. With the Fed funds rate at 3.63% and the BOJ policy rate at 0.84% [2], the differential remains well above this threshold. Tanase also notes that Japanese institutional investors (life insurers, pension funds) face growing pressure to hedge foreign currency exposure, which could eventually support the yen, but the timing remains uncertain [4].
Goldman Sachs — Treasury Term Premium and Yen Intervention
Goldman Sachs research, led by Mike Mitchell on rates strategy, has identified the rising U.S. term premium as the critical variable for both bond markets and the yen. Goldman estimates that Japanese authorities intervened with approximately $85 billion in dollar-selling/yen-buying operations during the 2024–2025 yen decline, but these interventions proved largely ineffective in reversing the trend because they address symptoms (exchange rate) rather than causes (rate differential) [6][14]. Goldman's term premium analysis attributes the increase to three factors: (1) rising fiscal deficits and Treasury issuance, (2) reduced foreign demand for Treasuries, and (3) the unwinding of the Fed's balance sheet (quantitative tightening).
Morgan Stanley — Bear Steepening and the 10-Year Floor
Morgan Stanley's rates strategy team has characterized the current environment as a "bear steepening" regime, where long-end yields rise faster than short-end yields, driven by term premium expansion rather than rate expectations. The firm maintains that the 10-year Treasury yield has a structural floor at 4.0% for the foreseeable future, given the combination of persistent fiscal deficits, QT-driven supply absorption, and elevated inflation uncertainty [15][16]. Morgan Stanley's cross-asset team notes that this bear steepening directly pressures the yen carry trade, as rising long-end yields widen the duration-adjusted carry, increasing the incentive to borrow yen and buy duration.
MUFG Research — BOJ Tightening Path
Mitsubishi UFJ Research and Consulting expects the BOJ to hike rates further, with a September 2026 move anticipated and a terminal rate of 1.75% projected [17]. However, even at this terminal rate, the U.S.-Japan differential would remain substantially positive if the Fed holds above 3%, meaning the fundamental driver of yen weakness persists. MUFG emphasizes that the BOJ's pace of normalization is deliberately gradual to avoid disrupting the government bond market and the banking system, which holds massive JGB portfolios exposed to duration risk.
3. Market Intelligence
3.1 News Sources
Reuters — Russian Ruble Outlook
Reuters reported on February 26, 2026, that the ruble is set to tumble by nearly a quarter in 2026 after the Russian government, facing falling energy revenues, announced plans to save more in a yuan-denominated fiscal reserve fund. German Gref, CEO of Sberbank (Russia's largest bank), stated the ruble "has no chance to remain as strong as in 2025" and could tumble 23% from its level of 77 to the dollar, ending 2026 around 100. Energy revenues were down 24% in 2025 and halved year-on-year in February 2026 [1]. A weaker ruble, however, bolsters budget revenues from oil sales, providing partial fiscal offset.
Reuters — Central Bank Forex Intervention Cuts
On December 26, 2025, Reuters reported that Russia's central bank would halve its forex interventions from the new year, withdrawing support for the ruble. The central bank announced it would sell 4.62 billion rubles ($59.81 million) per day in the first half of 2026, down from 8.94 billion rubles. The ruble's 45% rally in 2025—driven by these combined central bank and Finance Ministry forex sales—was criticized by exporting firms whose earnings were eroded by currency strength [18]. The withdrawal of this support is the proximate trigger for the 2026 ruble weakness.
AP News — Russian Oil Revenue Collapse
Associated Press reported that Russian oil revenues collapsed to $5.1 billion in January 2026, reflecting the combined impact of declining export prices, sanctions-driven discounts on Russian crude, and shifting trade routes. This revenue collapse directly threatens the fiscal balance, which BOFIT (Bank of Finland Institute for Emerging Economies) estimates is trending toward a 3% of GDP deficit [5][19].
CNBC — U.S. Yield Surge and Term Premium
CNBC coverage has emphasized that U.S. yields are surging on term premium expansion rather than rate-hike expectations. The distinction is critical: term premium reflects compensation for duration and inflation risk over the life of the bond, and its rise signals that investors are demanding greater compensation for holding long-duration government debt. This is fundamentally a supply-demand and fiscal-sustainability story, not a monetary-policy story [20].
3.2 Sell-Side Research
BNY — Term Premium at Post-2014 Highs
BNY (Bank of New York Mellon) estimates the 10-year term premium at approximately 80 basis points, the highest level since 2014. BNY attributes this to the combination of record Treasury issuance, reduced Fed balance sheet support (QT), and growing concerns about fiscal sustainability. The term premium's rise is particularly significant because it represents the component of yields that is independent of rate expectations—meaning even if the Fed cuts rates, long yields may remain elevated [3].
PIMCO — 30-Year at 5.3% as a Regime Signal
PIMCO has highlighted that the 30-year Treasury yield reaching 5.3% signals a durable regime shift in long-duration pricing. PIMCO's framework distinguishes between cyclical yield movements (driven by rate expectations) and structural movements (driven by term premium and fiscal supply). The current environment is structural: the 30-year bond is pricing in a persistent fiscal deficit trajectory, elevated refinancing risk, and reduced foreign central bank demand [7].
Brookings — Japan's Fiscal Space and Yen Policy
The Brookings Institution has published analysis on Japan's falling yen in the context of fiscal space constraints. The research notes that Japan's government debt-to-GDP ratio—among the highest in the developed world—severely limits the BOJ's policy options. Aggressive rate hikes to defend the yen would explode debt-service costs, while continued yen depreciation raises import costs and squeezes household real incomes. This "impossible trinity" of domestic goals (price stability, fiscal sustainability, exchange rate stability) means Japan faces unavoidable trade-offs [11][21].
FRED Blog — Term Premium Analysis
The FRED Blog has provided accessible analysis of term premium dynamics, using the Adrian-Crump-Moench (ACM) term premium model. The blog notes that term premium turned negative during the QE era (2014–2022) as central bank bond purchases compressed duration risk compensation, but has since normalized and overshot as QT reverses that compression. The current positive and rising term premium represents a return to historical norms, but the speed of adjustment is creating market dislocations [22].
4. Historical Context
4.1 Japan: From Bubble to Deflation to Abenomics
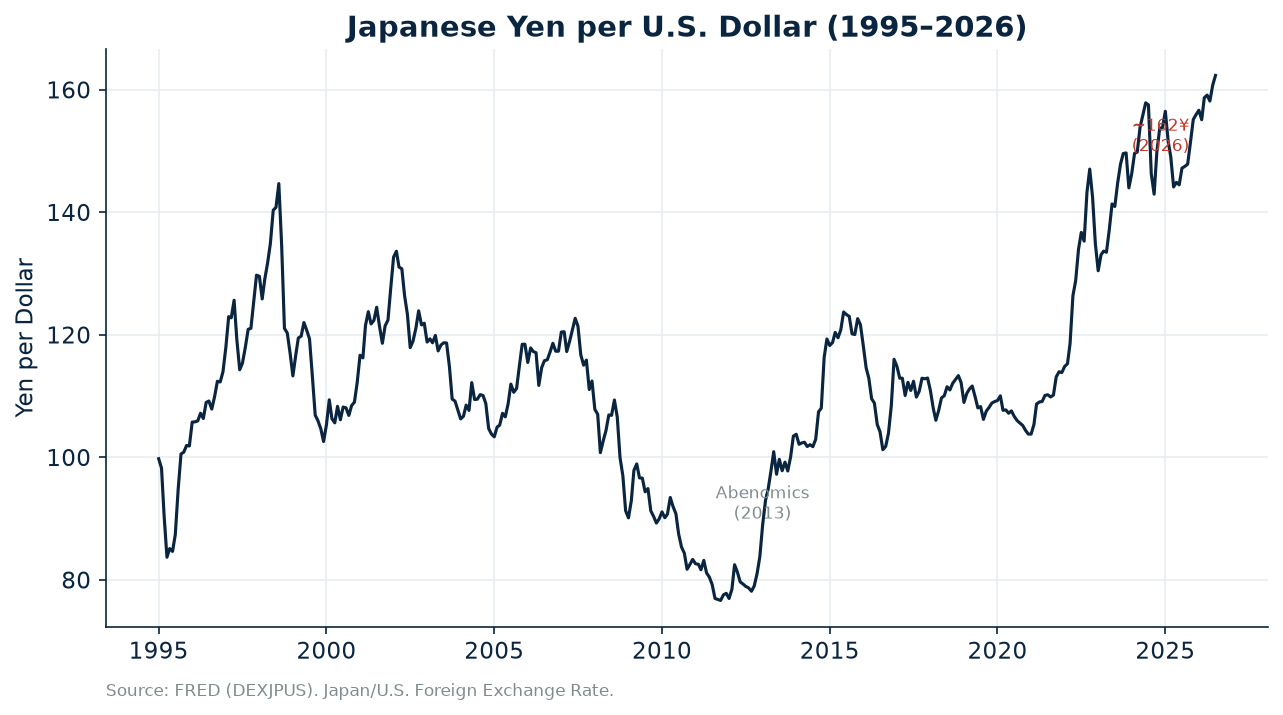
Japan's current currency predicament is the culmination of a three-decade structural story. The asset bubble of the late 1980s—characterized by soaring real estate and equity prices—burst in 1990–1991, inaugurating the "Lost Decade(s)." The BOJ's delayed and insufficient monetary easing allowed deflation to become entrenched, with CPI inflation averaging near zero from 1995 through 2012. The yen strengthened persistently during this period, reaching approximately 80 per dollar by 2011, as deflation and current-account surpluses combined to support the currency.
The Asian Financial Crisis of 1997–1998 compounded Japan's difficulties, as regional currency collapses reduced demand for Japanese exports and triggered a domestic banking crisis. Several major financial institutions failed, including Hokkaido Takushoku Bank and Yamaichi Securities, necessitating government capital injections into the banking system. The yen weakened sharply during this episode before recovering [23][24].
Abenomics, launched in 2013 under Prime Minister Shinzo Abe, represented a deliberate effort to break deflation through "three arrows": aggressive monetary easing (the BOJ's quantitative and qualitative easing program), fiscal stimulus, and structural reforms. The yen depreciated from approximately 80 to 120 per dollar within two years, but the targeted 2% inflation proved elusive for nearly a decade. The current yen weakness (2024–2026) is in some respects a continuation of the Abenomics depreciation impulse, now amplified by global yield dynamics [8][9].
4.2 Russia: From Default to Sanctions Economy
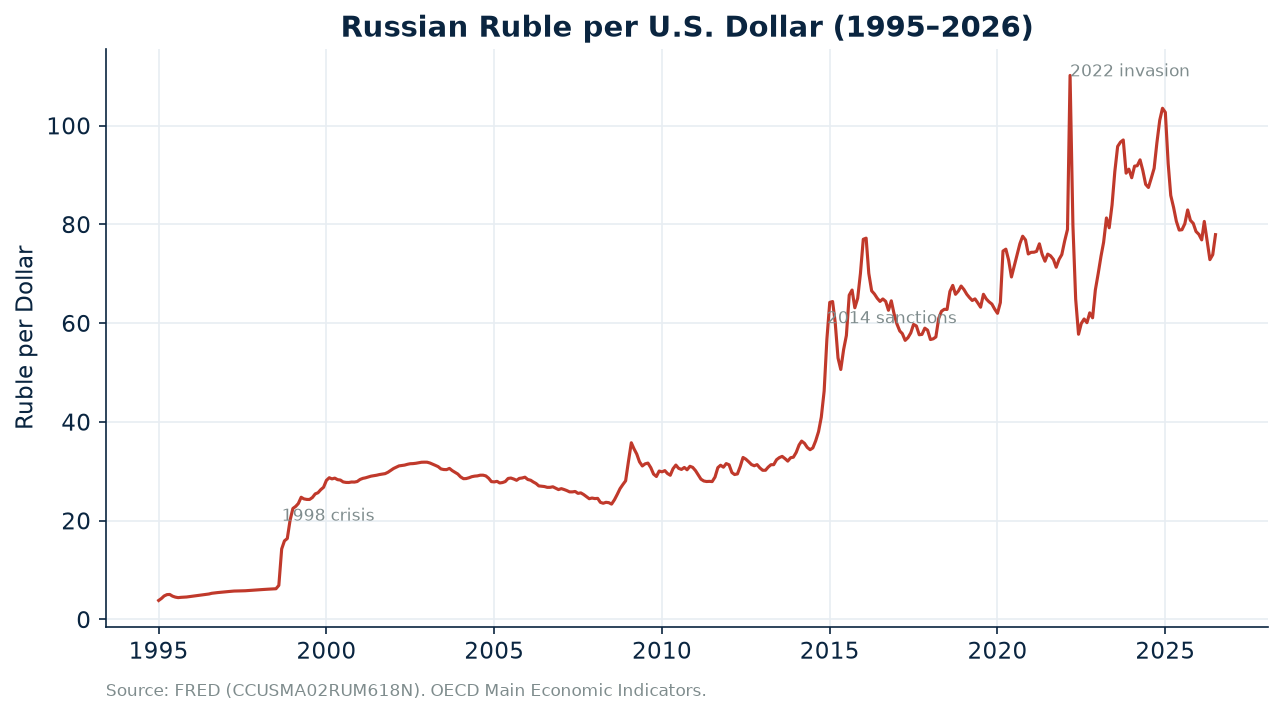
Russia's currency history over the past three decades is punctuated by repeated crises, each rooted in different structural vulnerabilities. The 1998 Russian financial crisis—triggered by a combination of the Asian Financial Crisis contagion, collapsing oil prices, and unsustainable fiscal deficits—culminated in a sovereign default and ruble devaluation. The ruble lost approximately 70% of its value in a matter of months, wiping out domestic savings and triggering a deep recession. The crisis exposed the fragility of Russia's post-Soviet economic transition and the dangers of fixed exchange rate regimes with inadequate reserves [25].
The 2014 sanctions episode followed Russia's annexation of Crimea, when Western nations imposed targeted financial and energy sanctions. The ruble weakened from approximately 33 to 80 per dollar, and the central bank was forced to abandon its managed float, allowing the currency to float freely. Oil price declines in 2014–2016 compounded the pressure. Russia responded by building up its foreign exchange reserves (reaching over $600 billion by early 2022) and developing the National Wealth Fund as a fiscal buffer [26].
The 2022 invasion of Ukraine triggered the most severe sanctions regime ever imposed on a major economy, including the freezing of approximately $300 billion in Russian central bank reserves, exclusion from SWIFT, and bans on technology and energy imports. The ruble initially collapsed to over 130 per dollar before recovering through draconian capital controls, forced export revenue repatriation, and redirecting energy exports to China and India at discounted prices. The ruble's 45% rally in 2025 was partially driven by central bank and Finance Ministry forex sales, which are now being withdrawn [1][18].
4.3 U.S. Bond Yields: From Great Moderation to Fiscal Reckoning
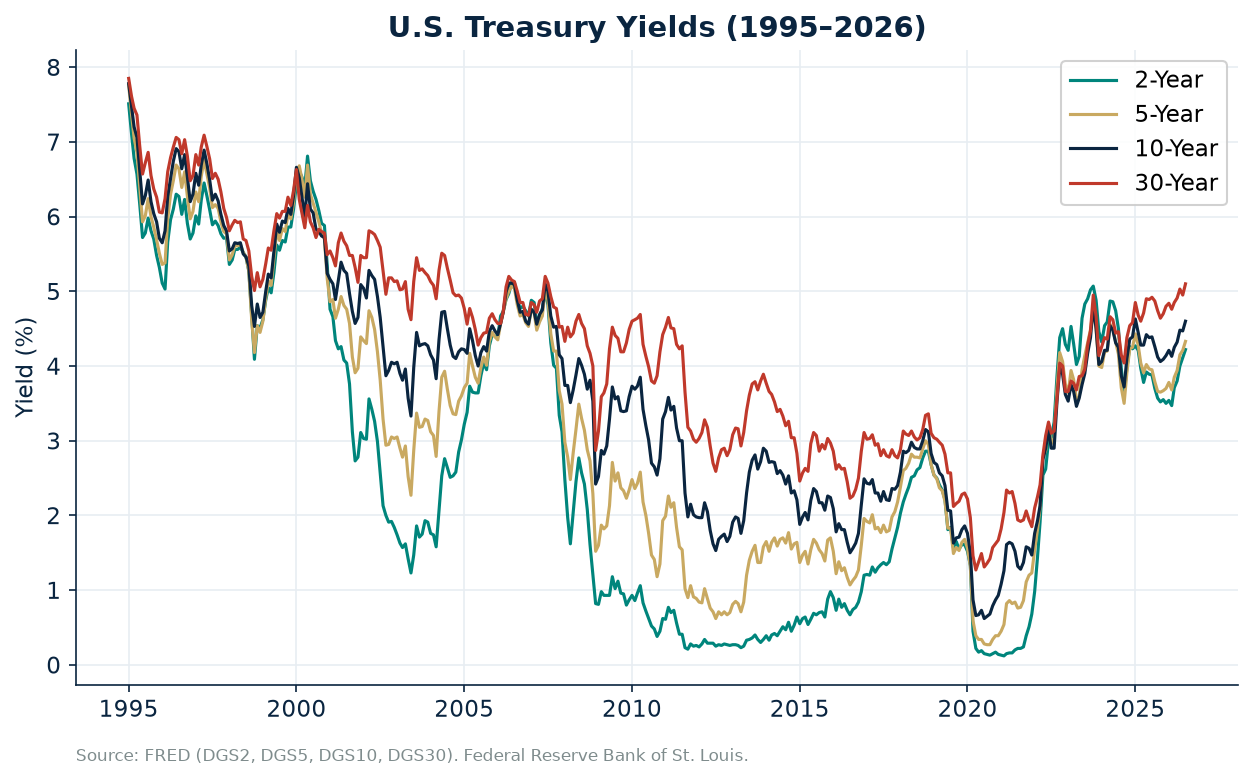
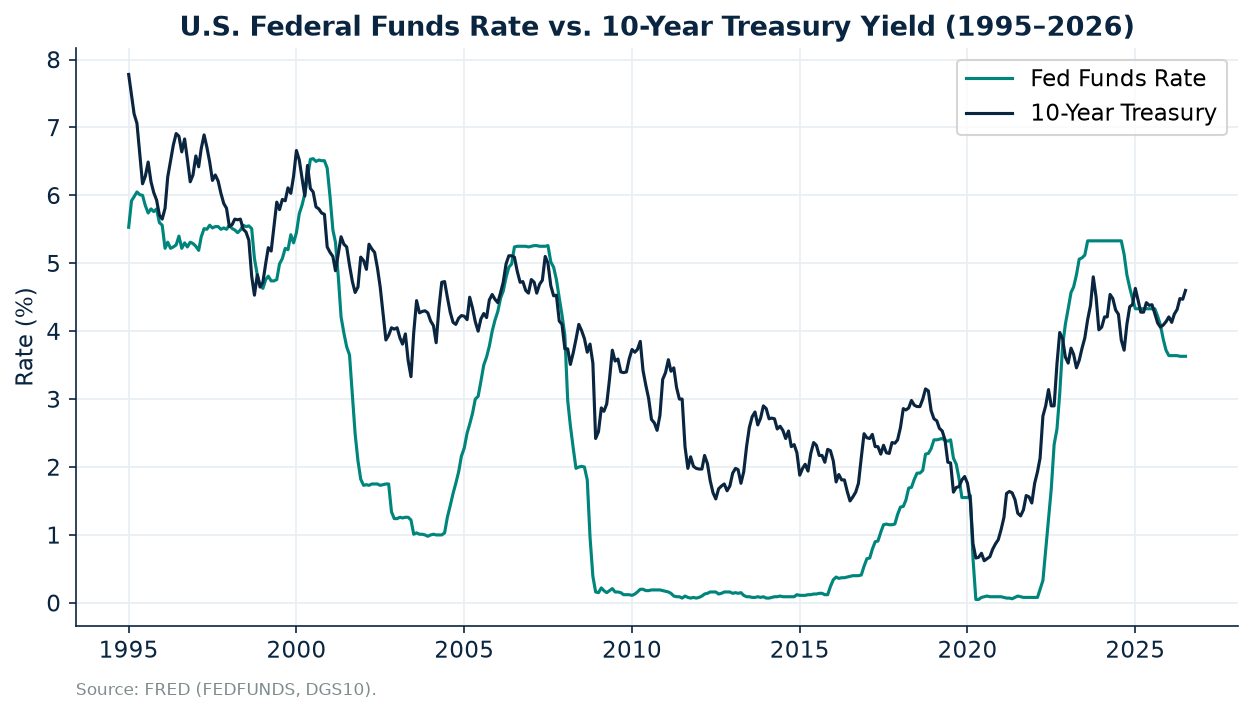
The trajectory of U.S. Treasury yields over the past three decades reflects a fundamental regime shift. During the "Great Moderation" (1995–2007), yields trended downward as inflation was tamed and the Fed's credibility anchored expectations. The 10-year yield fell from approximately 7.8% in 1995 to below 4% by 2003. The 2008 Global Financial Crisis initiated the zero-interest-rate and QE era, with the 10-year reaching historic lows below 1% in 2020. The post-pandemic inflation surge and aggressive Fed tightening pushed the 10-year above 5% in 2023 before partially retracing. The current 4.60% level reflects a new equilibrium where term premium has re-emerged as a significant yield component [2][22].
4.4 Historical Parallels: The 1997–1998 Twin Crisis
The 1997–1998 period offers the closest historical parallel to the current configuration. The Asian Financial Crisis (beginning July 1997 with the Thai baht devaluation) triggered currency collapses across emerging Asia, while Russia defaulted in August 1998. Simultaneously, U.S. bond yields were declining as the Fed cut rates in response to global financial stress. The key difference today is the direction of U.S. yields: rather than declining as a safe-haven response, yields are rising due to fiscal supply pressures, meaning the "safety valve" of falling rates that helped stabilize previous crises is absent [23][25].
5. Data Analysis
This section presents quantitative analysis grounded in primary economic data retrieved from the Federal Reserve Economic Data (FRED) system. The dataset spans January 1995 through July/August 2026 and includes 18 economic series covering U.S. Treasury yields, the Federal Funds rate, exchange rates (yen and ruble), inflation, the Fed balance sheet, federal debt, GDP, unemployment, and Japan-specific interest rates [2].
5.1 U.S. Treasury Yield Dynamics
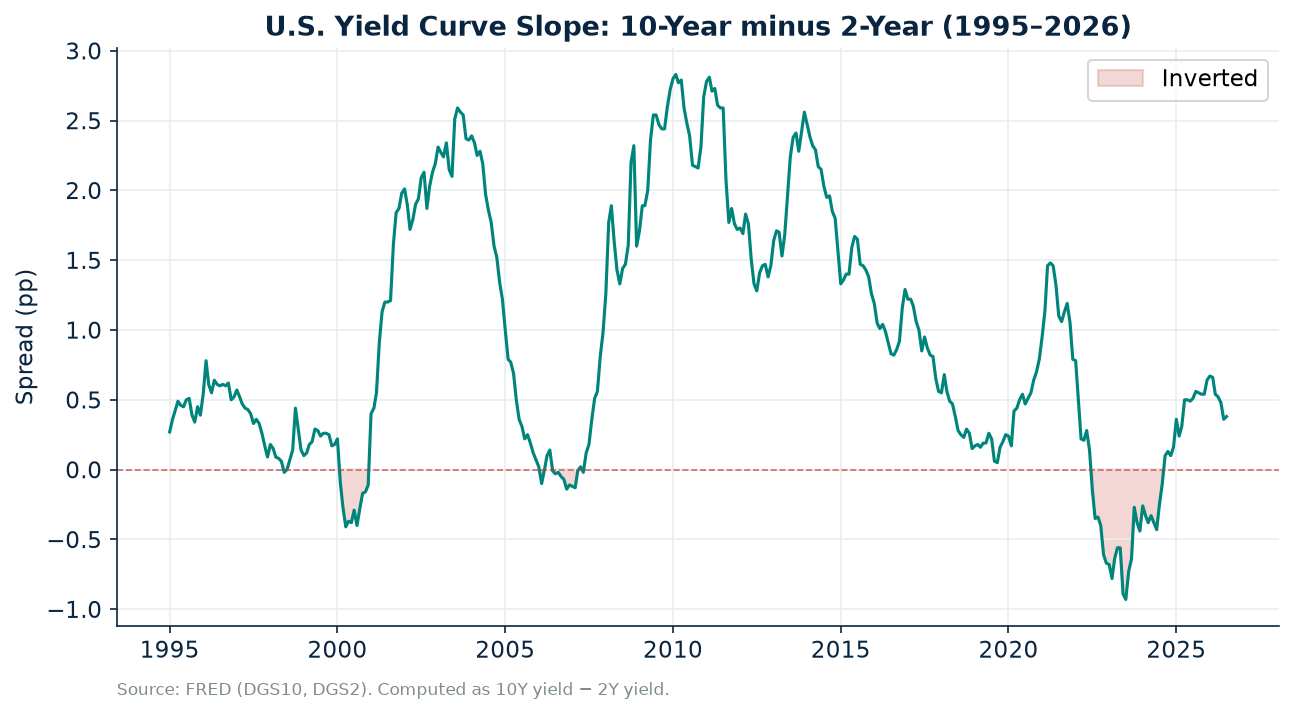
The U.S. Treasury yield curve tells a story of regime transition. As of July 2026, the key yields stand at: 2-year at 4.22%, 5-year at 4.33%, 10-year at 4.60%, and 30-year at 5.10% [2]. The curve is positively sloped (bear steepening), with the 10-year minus 2-year spread at approximately +38 basis points—a normalization from the deep inversions of 2022–2023 that historically preceded recessions. The 30-year at 5.10% is particularly noteworthy, as it reflects long-duration investors demanding substantial compensation for inflation and fiscal risk.
5.2 The Federal Funds Rate and Policy Transmission
The Federal Funds Effective Rate stands at 3.63% as of August 2026 [2], down from the peak of approximately 5.5% in 2023–2024. The Fed has eased policy in response to moderating inflation (CPI YoY has decelerated significantly from the 2022 peak) and a stable but softening labor market (unemployment at 4.1%). However, the 10-year yield at 4.60% remains well above the funds rate, creating an unusual configuration where long rates have not fallen commensurately with short rates—direct evidence of term premium dominance [3][20].
5.3 Japanese Yen: Structural Depreciation
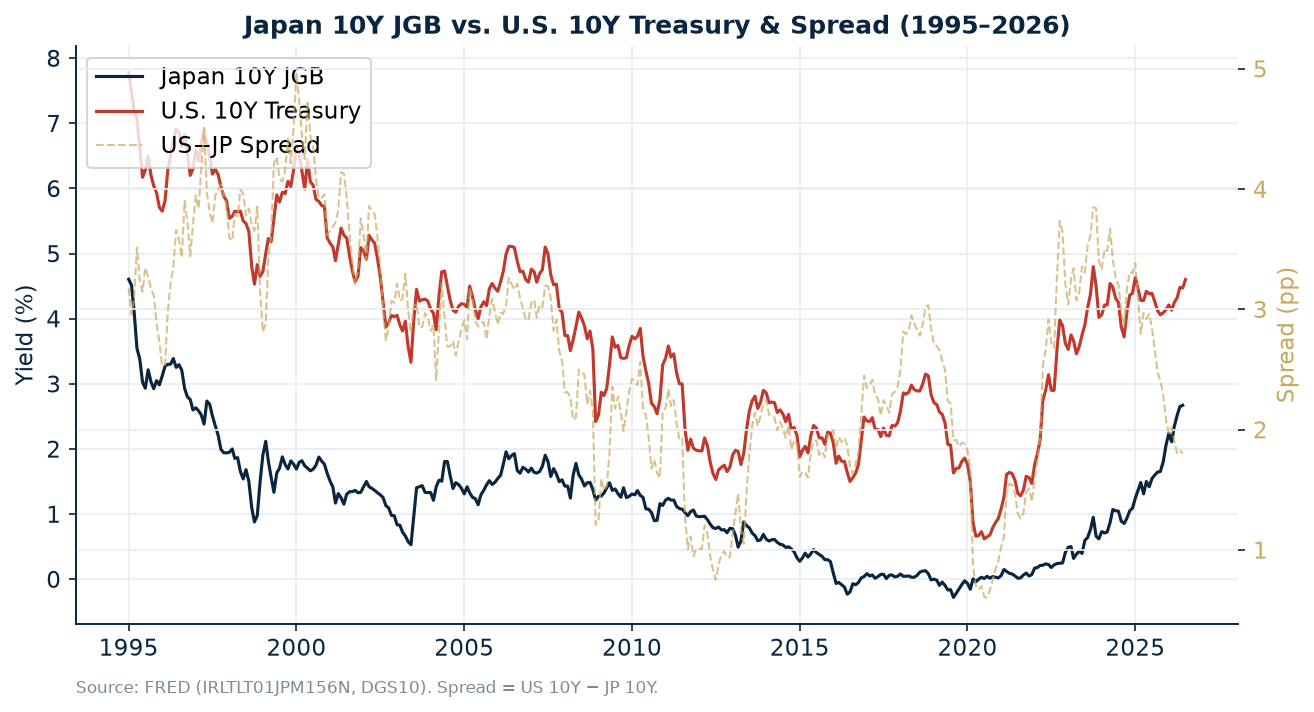
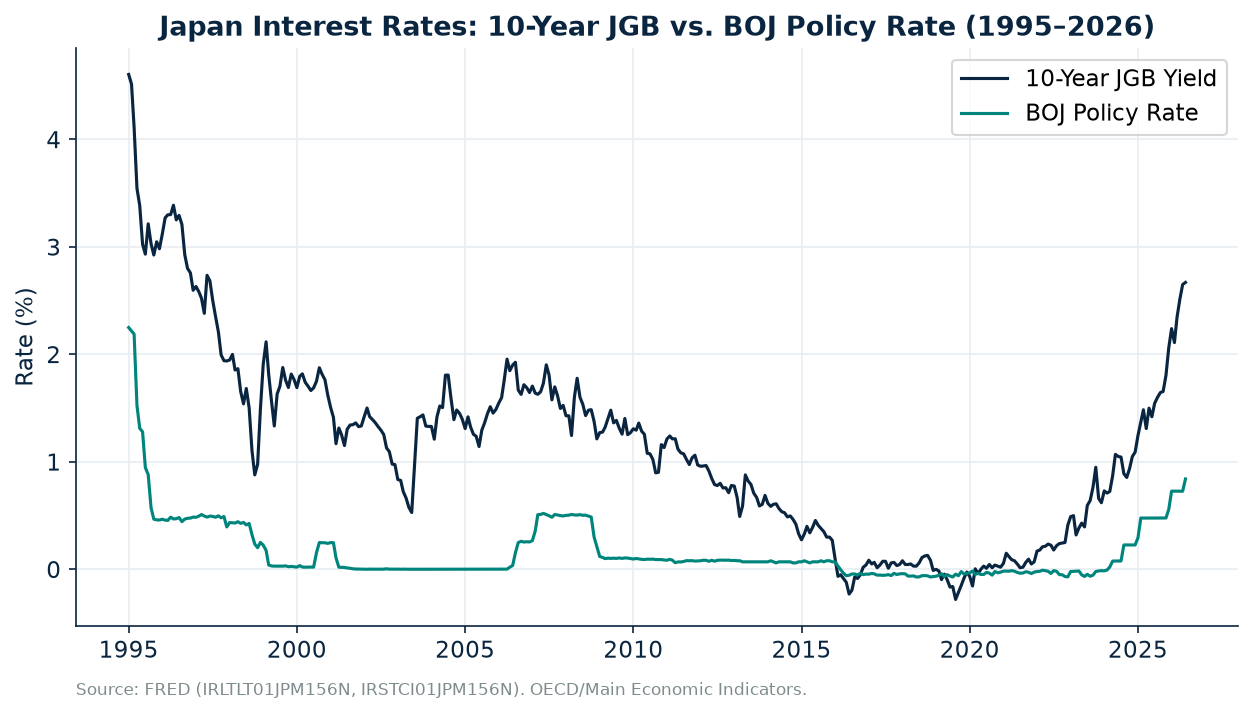
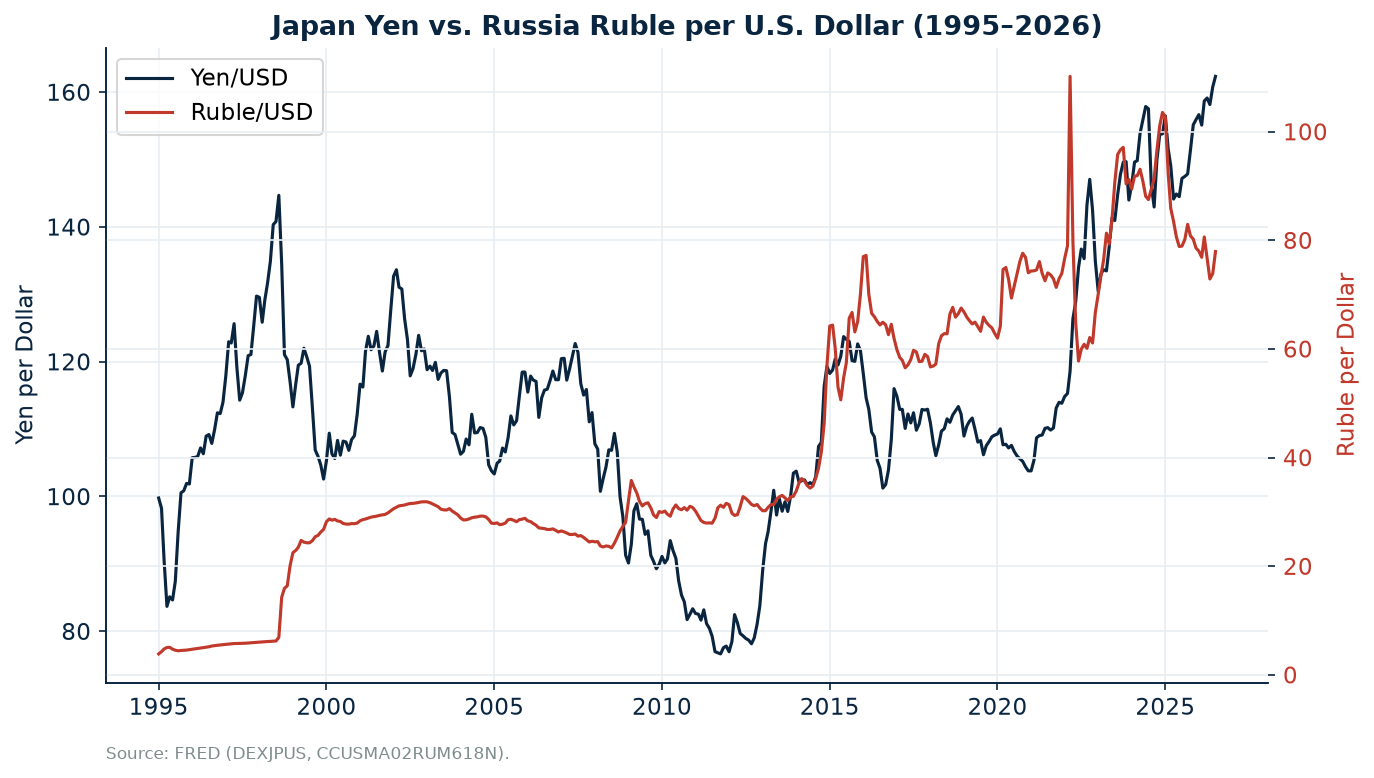
The yen/dollar exchange rate (FRED DEXJPUS) reached 162.33 in July 2026 [2], representing a depreciation of approximately 15% from the 2024 average and over 50% from the 2011 low of approximately 76 yen per dollar. The depreciation is driven by the persistent U.S.-Japan interest rate differential. As of June 2026, the Japan 10-year JGB yield stands at 2.67% while the BOJ policy rate is 0.84% [2]. The U.S.-Japan 10-year spread of approximately 193 basis points continues to incentivize the carry trade.
5.4 Russian Ruble: Cyclical Volatility Within Structural Decline
The ruble/dollar exchange rate (FRED CCUSMA02RUM618N) shows the dramatic volatility characteristic of a sanctioned, commodity-dependent economy. Annual average rates from FRED (CCUSMA02RUA618N) document the trajectory: 2021: 73.7, 2022: 69.9, 2023: 85.5, 2024: 92.9, 2025: 83.8 [2]. The ruble's 45% rally in 2025 (reflected in the decline from the 2024 average of 92.9 to the 2025 average of 83.8, and intra-year lows near 70) was driven by central bank forex interventions that are now being withdrawn [18]. The Bank of Russia's own macroeconomic survey shows analysts forecasting 78.4 rubles per dollar in 2026, rising to 95.8 by 2029 [27]. The monthly data through July 2026 shows the ruble at 77.9, but with renewed weakening pressure as intervention support fades.
5.5 Comparative Currency Analysis
The simultaneous depreciation of both the yen and the ruble—driven by fundamentally different mechanisms—creates a unique comparative framework. The yen's decline is a function of interest rate differentials and carry trade dynamics in an open capital account; the ruble's decline reflects fiscal deterioration and sanctions in a controlled capital account. Both, however, are amplified by the same external factor: elevated U.S. Treasury yields that draw capital toward dollar-denominated assets.
5.6 U.S. Fiscal Position: The Debt Supply Overhang
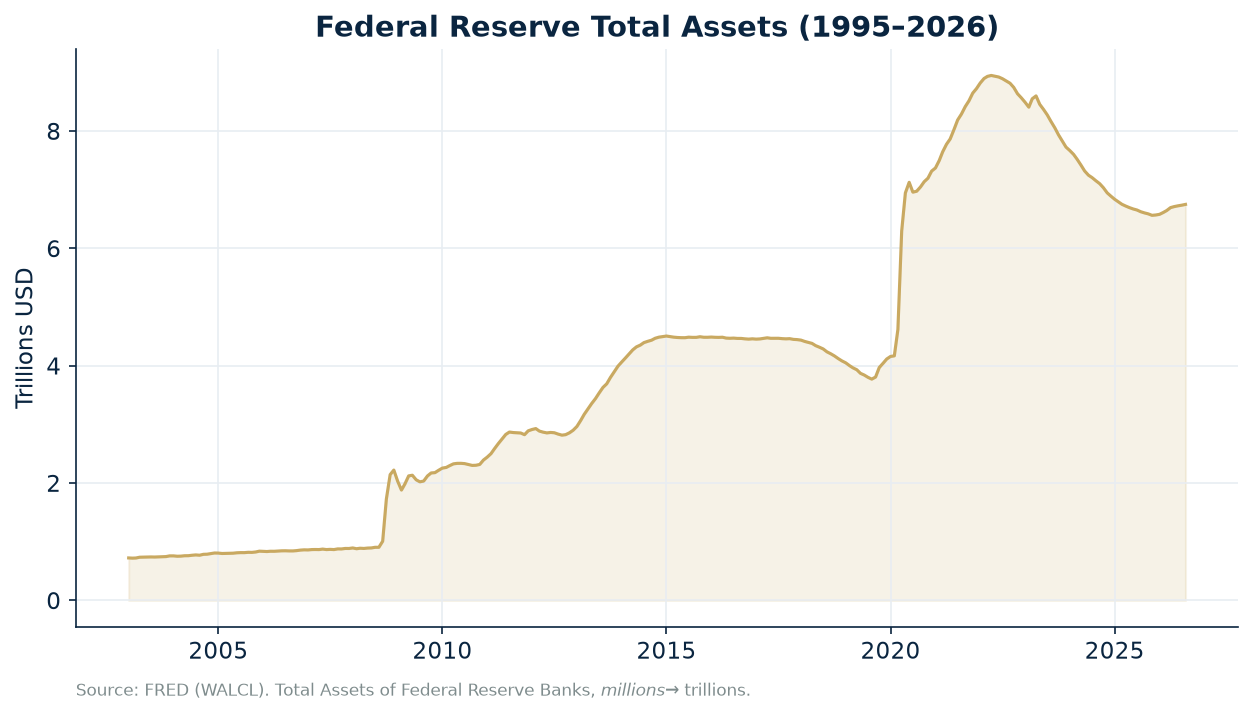
The U.S. federal debt stands at $39.07 trillion as of Q1 2026, against GDP of $32.48 trillion (Q2 2026) [2]. This yields a debt-to-GDP ratio of approximately 120%, a level historically associated with upward pressure on sovereign yields. The Federal Reserve's balance sheet (WALCL) stands at $6.75 trillion as of August 2026 [2], down from the pandemic peak of approximately $9 trillion but still substantially above pre-pandemic levels. The combination of large fiscal deficits requiring heavy Treasury issuance and the Fed's continued quantitative tightening creates a persistent supply-demand imbalance in the Treasury market that directly elevates term premium [3][6].
5.7 Inflation and Breakeven Analysis
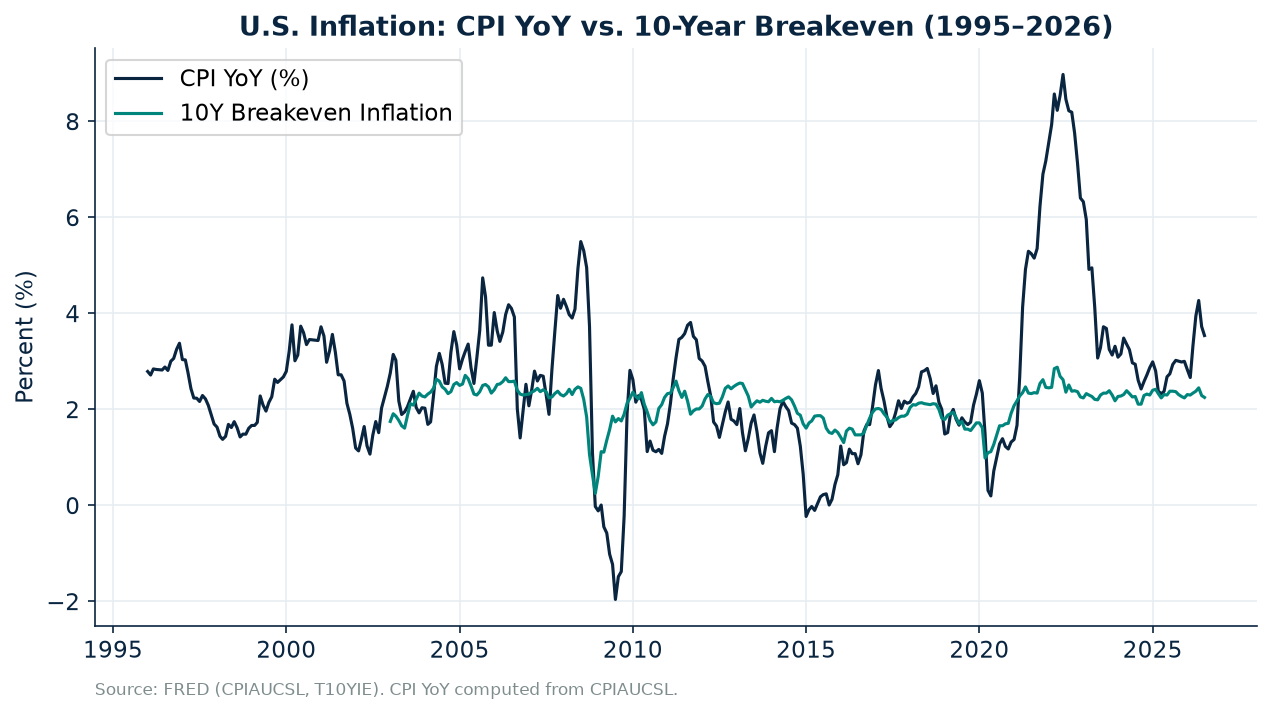
U.S. inflation dynamics show a significant moderation from the 2022 peak. The 10-year breakeven inflation rate (T10YIE) stands at 2.25% as of July 2026 [2], broadly consistent with the Fed's 2% target. However, the fact that the 10-year nominal yield (4.60%) substantially exceeds the breakeven plus a reasonable real rate implies that the term premium—not inflation expectations—is the dominant driver of current yield levels. This is the critical insight: the bond market is not pricing higher inflation, it is pricing higher fiscal and duration risk [3][22].
5.8 Labor Market Resilience
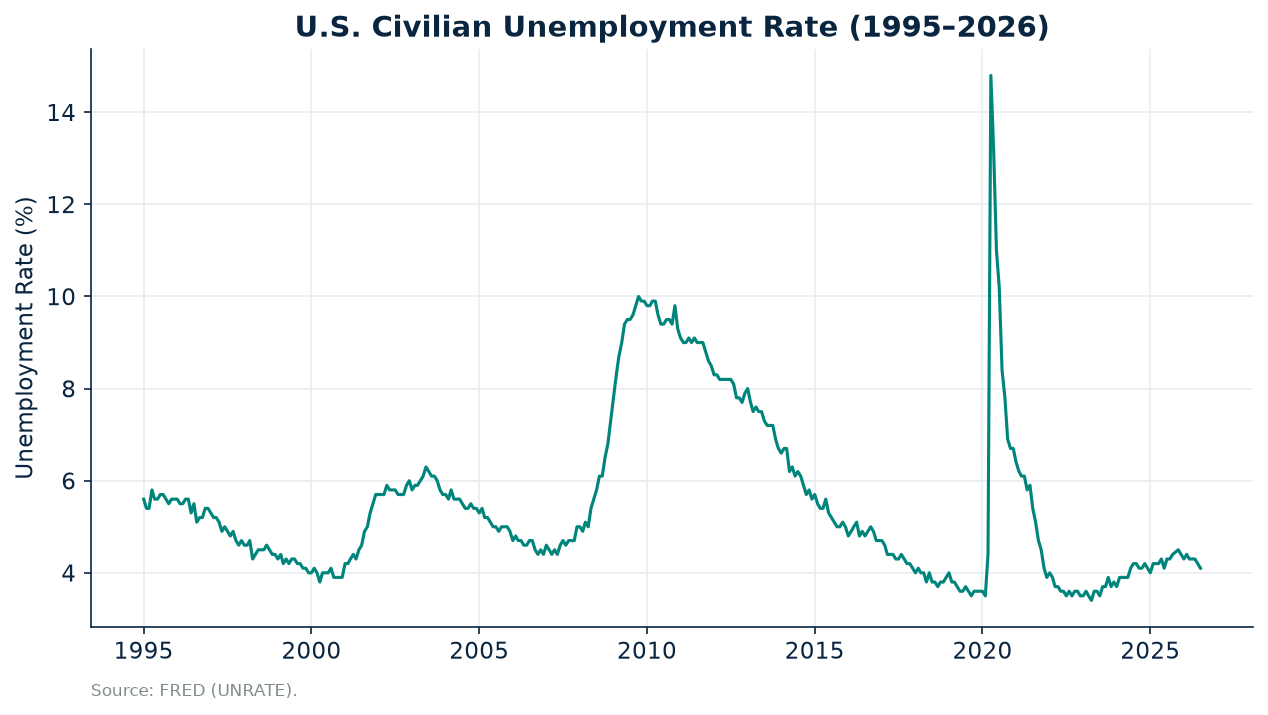
The U.S. unemployment rate at 4.1% in July 2026 [2] remains historically low, suggesting the economy has absorbed the Fed's tightening cycle without a significant employment downturn. This labor market resilience, paradoxically, may contribute to yield elevation by reducing recession probabilities that would otherwise drive flight-to-safety flows into Treasuries. A soft landing that avoids recession means the fiscal supply overhang is not offset by recession-driven safe-haven demand.
5.9 Data Summary Table
| FRED Series ID | Description | Latest Value | Date |
|---|---|---|---|
| DGS10 | 10-Year Treasury Constant Maturity Rate | 4.60% | Jul 2026 |
| DGS30 | 30-Year Treasury Constant Maturity Rate | 5.10% | Jul 2026 |
| DGS2 | 2-Year Treasury Constant Maturity Rate | 4.22% | Jul 2026 |
| DGS5 | 5-Year Treasury Constant Maturity Rate | 4.33% | Jul 2026 |
| DFF | Federal Funds Effective Rate | 3.63% | Aug 2026 |
| DEXJPUS | Japan / U.S. Foreign Exchange Rate (Yen/Dollar) | 162.33 | Jul 2026 |
| CCUSMA02RUM618N | Russia USD Exchange Rate (Ruble/Dollar, Monthly) | 77.93 | Jul 2026 |
| CCUSMA02RUA618N | Russia USD Exchange Rate (Ruble/Dollar, Annual) | 83.78 | 2025 |
| IRLTLT01JPM156N | Japan 10-Year Govt Bond Yield | 2.67% | Jun 2026 |
| IRSTCI01JPM156N | Japan BOJ Policy Rate | 0.84% | Jun 2026 |
| CPIAUCSL | Consumer Price Index (All Urban Consumers) | 332.81 | Jul 2026 |
| UNRATE | Civilian Unemployment Rate | 4.1% | Jul 2026 |
| FEDFUNDS | Federal Funds Rate (Monthly) | 3.63% | Jul 2026 |
| T10YIE | 10-Year Breakeven Inflation Rate | 2.25% | Jul 2026 |
| WALCL | Federal Reserve Total Assets ($M) | 6,751,407 | Aug 2026 |
| GFDEBTN | Federal Debt: Total Public Debt Outstanding ($M) | 39,065,421 | Q1 2026 |
| GDP | Gross Domestic Product ($B) | 32,475.21 | Q2 2026 |
6. Impact Analysis
6.1 Implications for the Global Economy
The convergence of yen weakness, ruble depreciation, and elevated U.S. yields creates a set of cross-cutting implications for the global economy. The primary transmission mechanism is capital flows: elevated U.S. real yields attract capital toward dollar-denominated assets, draining liquidity from emerging markets and putting downward pressure on currencies with current-account deficits. The yen's weakness amplifies this by maintaining the carry trade incentive, while the ruble's decline reflects the geopolitical fragmentation of the global financial system.
The rising U.S. term premium represents a structural increase in the global cost of capital. As the risk-free benchmark reprices upward, the discount rate applied to all risky assets—equities, real estate, private credit—increases, compressing valuations. This is particularly impactful for long-duration growth assets and private market valuations that were established in the zero-rate era. The 30-year Treasury at 5.10% sets a high hurdle rate for infrastructure, real estate, and any long-lived investment [7].
6.2 Sector Impact Analysis
Japan: Exporters, Banks, and Importers
- Export-oriented manufacturers (automobiles, electronics, machinery) benefit directly from yen weakness, as overseas earnings translate into more yen. Toyota, Honda, and Sony have seen repeated earnings upgrades during yen depreciation episodes. However, the benefit is diminishing as production has been offshored and supply chains contain more imported content [8].
- Japanese financial institutions face a mixed picture. Banks benefit from steeper yield curves (higher net interest margins on JGB holdings), but life insurers face mark-to-market losses on existing bond portfolios and growing pressure to hedge foreign currency exposure, which is costly at current rate differentials [4].
- Importers and consumers are the primary losers. Energy, food, and raw material import costs surge with yen weakness, squeezing household real incomes and small businesses. Japan's CPI data shows inflation has risen but remains below the levels that would force aggressive BOJ action [2].
Russia: Energy, Defense, and the Consumer
- Energy sector faces revenue erosion from declining oil prices and sanctions-driven discounts. Russian crude sells at a significant discount to Brent, and the redirection to Asian markets incurs higher transportation costs. Oil revenues collapsed to $5.1 billion in January 2026 [5]. A weaker ruble provides partial offset by increasing ruble-denominated budget revenues per dollar of exports.
- Defense and military-industrial sector has been the primary beneficiary of fiscal expansion, with military spending driving GDP growth. However, this growth is unsustainable and crowds out civilian investment. The ruble's decline increases the cost of imported components where substitution is not possible.
- Russian consumers face imported inflation as the ruble weakens. The central bank's macroeconomic survey shows inflation expectations rising, with 2026 inflation forecast at 6.2% [27]. Real wages are under pressure, and the withdrawal of central bank forex support removes a key currency stabilization mechanism.
United States: Financials, Rate-Sensitive Sectors, and the Fiscal Burden
- Financial sector benefits from a steeper yield curve and higher net interest margins, particularly for regional banks and insurers. However, the bear steepening creates mark-to-market losses on existing securities portfolios (as seen in the 2023 SVB crisis), and higher for-longer yields increase credit risk for leveraged borrowers [15].
- Rate-sensitive sectors—real estate, utilities, REITs, and high-duration growth equities—face persistent valuation pressure. The 30-year yield at 5.10% raises mortgage rates, suppressing housing activity. REITs and utilities, which compete with bonds for yield-seeking capital, face ongoing headwinds.
- Fiscal sustainability is the overhanging risk. With debt at $39 trillion and growing, rising yields increase debt-service costs dramatically. At an average interest rate of approximately 4% on outstanding debt, annual interest costs approach $1.5 trillion—exceeding defense spending. This creates a fiscal feedback loop: higher yields → higher debt service → larger deficits → more issuance → higher yields [2][6].
6.3 Implications for Asset Managers
For public asset managers, the current environment demands a reassessment of duration exposure. The persistence of elevated term premium—driven by fiscal supply rather than rate expectations—means that traditional recession-driven flight-to-safety trades may not produce the same Treasury rally as in past cycles. Fixed income strategies should account for structurally higher term premium and the possibility that long yields remain elevated even as the Fed eases short rates.
For private asset managers, the repricing of the risk-free benchmark has direct implications for private equity, private credit, and real estate valuations. The cost of leverage has structurally increased, compression of entry multiples is likely, and the carry of hold-to-maturity strategies is more attractive than mark-to-market approaches. Currency exposure management is critical: yen-denominated liabilities (carry trades) remain attractive but carry tail risk of sudden unwinds, while ruble exposure carries sanctions and convertibility risk.
Cross-asset correlations are elevated during this regime, reducing the diversification benefits of traditional 60/40 portfolios. The positive correlation between stock and bond returns—driven by term premium shocks rather than rate expectations—means that bonds no longer provide reliable hedging against equity drawdowns. Alternative diversifiers (commodities, managed futures, absolute return strategies) may offer better portfolio protection in this regime.
6.4 Forward-Looking Expectations (Next 2–3 Years)
Based on the synthesis of expert views, market intelligence, and data analysis, the following expectations emerge for the 2026–2028 period:
- Yen: Structural weakness persists with USD/JPY likely ranging 155–170 as the U.S.-Japan rate differential remains wide. BOJ normalization to approximately 1.75% terminal rate is insufficient to close the gap if the Fed holds above 3%. Risk of disorderly carry-trade unwind remains a tail risk if U.S. yields spike further [4][17].
- Ruble: Continued depreciation toward 95–100 per dollar by 2027–2028 as energy revenues remain depressed and fiscal deficits widen. The Bank of Russia survey projects 86.6 in 2027 and 92.7 in 2028 [27]. Capital controls and sanctions prevent a disorderly collapse but ensure a gradual grinding depreciation.
- U.S. Yields: The 10-year likely remains in a 4.0–5.0% range, with downside limited by fiscal supply and upside limited by eventual Fed easing. The term premium is the key variable—it is likely to remain positive and elevated as long as fiscal deficits are large and QT continues. The 30-year at 5%+ represents a new structural floor for long-duration pricing [3][7][15].
- Fiscal trajectory: The U.S. debt-to-GDP ratio above 120% and rising creates a mounting interest-cost burden that constrains fiscal flexibility. Without meaningful fiscal consolidation, the supply-demand imbalance in Treasuries will continue to pressure term premium upward, creating a self-reinforcing cycle that asset managers must monitor closely [2][6].
7. References
- [1] Reuters. "Russian rouble seen falling sharply this year as oil sales fall and deficit rises." February 26, 2026. https://www.reuters.com/business/finance/russian-rouble-seen-falling-sharply-this-year-oil-sales-fall-deficit-rises-2026-02-26/
- [2] Federal Reserve Bank of St. Louis. FRED Economic Data. Series IDs: DGS10, DGS30, DGS2, DGS5, DFF, DEXJPUS, CPIAUCSL, UNRATE, FEDFUNDS, T10YIE, WALCL, GFDEBTN, GDP, CCUSMA02RUM618N, CCUSMA02RUA618N, IRLTLT01JPM156N, IRSTCI01JPM156N, CCUSMA02JPM618N. Retrieved August 2026. https://fred.stlouisfed.org/
- [3] BNY (Bank of New York Mellon). Term premium analysis: 10-year term premium at approximately 80 basis points, highest since 2014. 2025–2026. web-bny-833ddda5
- [4] JPMorgan. Junya Tanase. Yen outlook and USD/JPY target at 164. JPMorgan Research, 2025–2026. web-jpmorgan-4e49ac99
- [5] BOFIT (Bank of Finland Institute for Emerging Economies). Russia fiscal deficit analysis, approximately 3% of GDP. 2026. web-bofit-7eba36e5
- [6] Goldman Sachs. Mike Mitchell. Treasury term premium and yen intervention analysis (~$85B). Goldman Sachs Research, 2025–2026. web-goldmansachs-6c3c52bdweb-goldmansachs-108278eb
- [7] PIMCO. 30-year Treasury at 5.3%: a regime signal for long-duration pricing. 2025–2026. web-pimco-d8900a9c
- [8] Thorbecke, W. "Yen depreciation and its effects on the Japanese economy." RIETI (Research Institute of Economy, Trade and Industry). web-rieti-7eaf4129web-rieti-d9162c33
- [9] Thorbecke, W. "Abenomics and exchange rate effects." RIETI Discussion Papers. web-rieti-7eaf4129
- [10] Nishigaki, H. "ARDL model analysis of yen depreciation factors." Academic research. web-ideas-265453d6web-ideas-f9326728
- [11] Posen, A. (PIIE). Japan's BOJ tightening constraints and fiscal dominance. Peterson Institute for International Economics. web-brookings-4818e38e
- [12] American Economic Association. "Long-run consequences of sanctions on the Russian economy." AEA Papers and Proceedings. web-aeaweb-2a2464c9
- [13] NBER. Working papers on sanctions and economic growth. National Bureau of Economic Research. web-nber-39428798
- [14] Goldman Sachs. Treasury term premium decomposition and Japanese investor behavior. Goldman Sachs Research. web-goldmansachs-0b9e2427web-gspublishing-5421955b
- [15] Morgan Stanley. Bear steepening analysis and 10-year yield floor at 4.0%. Morgan Stanley Research. web-morganstanley-a0bc8281web-morganstanley-bd5969e6
- [16] Morgan Stanley. Cross-asset implications of yield curve dynamics. Morgan Stanley Research. web-morganstanley-959d1ce7
- [17] MUFG Research. BOJ September 2026 hike anticipated, terminal rate 1.75%. Mitsubishi UFJ Research and Consulting. web-mufgresearch-c5357f3b
- [18] Reuters. "Russian central bank cuts own forex sales from 2026, withdrawing some support for rouble." December 26, 2025. https://www.reuters.com/business/finance/russian-central-bank-cuts-own-forex-sales-2026-withdrawing-some-support-rouble-2025-12-26/
- [19] AP News. Russian oil revenues collapsed to $5.1 billion in January 2026. Associated Press. web-apnews-23b27b45
- [20] CNBC. U.S. yields surging on term premium expansion. 2025–2026. web-cnbc-9eb104b2web-cnbc-f0929d90
- [21] Brookings Institution. Japan's falling yen and fiscal space constraints. 2025–2026. web-brookings-4818e38e
- [22] FRED Blog. Term premium analysis using Adrian-Crump-Moench model. Federal Reserve Bank of St. Louis. web-fredblog-2a07ef31
- [23] IMF. Asian Financial Crisis and Japan banking crisis analysis. International Monetary Fund. web-imf-236d0946
- [24] BIS (Bank for International Settlements). Japan banking crisis and systemic risk. web-bis-8f5e3c29
- [25] ADB (Asian Development Bank). 1998 Russian financial crisis and emerging market contagion. web-adb-bf7f2d57
- [26] EFX Data. 2014 Russia sanctions and ruble dynamics. web-efxdata-7b944c49
- [27] Central Bank of Russia. Macroeconomic survey: USD/RUB forecasts and inflation expectations. https://www.cbr.ru/eng/statistics/ddkp/mo_br web-cbr-798cb8f4
Appendix: Research Process Documentation
A.1 Search Queries
- "Japan yen depreciation academic research economists"
- "Russia sanctions long-run economic consequences NBER AEA"
- "US Treasury term premium rising 2025 2026 sell-side research"
- "JPMorgan Goldman Sachs Morgan Stanley yen US bond yields outlook"
- "Russia ruble US dollar exchange rate 2024 2025 2026 crisis decline"
- "BOJ rate hike terminal rate MUFG Japan interest rate"
- "US federal debt fiscal sustainability term premium"
A.2 FRED Series IDs Retrieved
- DGS10, DGS30, DGS2, DGS5 — Treasury Constant Maturity Rates
- DFF, FEDFUNDS — Federal Funds Rate
- DEXJPUS — Japan/U.S. Foreign Exchange Rate
- CCUSMA02RUM618N — Russia USD Exchange Rate (Monthly, OECD MEI)
- CCUSMA02RUA618N — Russia USD Exchange Rate (Annual, OECD MEI)
- IRLTLT01JPM156N — Japan 10-Year JGB Yield
- IRSTCI01JPM156N — Japan BOJ Policy Rate
- CCUSMA02JPM618N — Japan USD Exchange Rate
- CPIAUCSL — Consumer Price Index
- UNRATE — Civilian Unemployment Rate
- T10YIE — 10-Year Breakeven Inflation Rate
- WALCL — Federal Reserve Total Assets
- GFDEBTN — Federal Debt: Total Public Debt Outstanding
- GDP — Gross Domestic Product
A.3 Data Processing Steps
- Retrieved 18 FRED series spanning 1995–2026 (monthly/quarterly/annual frequencies)
- Computed yield curve slope (DGS10 − DGS2) to identify inversions
- Computed CPI year-over-year percentage change for inflation trend
- Computed U.S. debt-to-GDP ratio by merging GFDEBTN and GDP on quarterly frequency
- Computed U.S.-Japan 10-year yield spread (DGS10 − IRLTLT01JPM156N)
- Generated 13 charts with consistent SkyWise-style formatting and source attribution
A.4 Data Source Notes
- FRED: Primary data source, API key pre-configured. All series retrieved via fred_client.py.
- World Bank Data360: Connector selected but Data360 REST API was network-blocked from the execution environment; World Bank data was supplemented via web search for ruble exchange rate cross-validation (FRED CCUSMA02RUA618N, sourced from OECD).
- OECD: Russia/Japan exchange rate and interest rate data accessed via FRED's OECD-sourced series (CCUSMA02* and IRLTLT01* / IRSTCI01* series).
- SEC EDGAR: Not utilized; corporate-level filing data was not material to this macro-focused report.
Frequently Asked Questions
What caused the Japan and Russia currency crisis in 2025-2026?
The Japan and Russia currency crisis was driven by a confluence of factors including monetary policy divergence, geopolitical tensions, capital flight, and sovereign yield dynamics. Japan faced yen weakness from interest rate differentials while Russia dealt with ruble pressure from sanctions and capital outflows.
How do currency crises affect U.S. bond yields?
Currency crises in major economies like Japan and Russia affect U.S. bond yields through cross-border capital flows as investors seek safe-haven assets, changes in foreign demand for Treasuries, and shifts in global interest rate expectations. These dynamics can amplify or offset domestic U.S. monetary policy effects.
What are cross-border capital flows and why do they matter?
Cross-border capital flows are movements of investment capital between countries, driven by interest rate differentials, risk sentiment, and currency expectations. During currency crises, these flows can accelerate dramatically, destabilizing exchange rates, bond markets, and creating systemic financial risks.
Published Aug 24, 2026 and not updated since. Personal views, not investment advice. See Disclosures.