Executive Summary
Central Thesis: The Federal Reserve faces its most significant test of independence in decades as Chair Jerome Powell's term expires in May 2026, coinciding with persistent inflation above target and political pressure from the Trump administration. Our analysis indicates a 65% probability of gradual policy normalization to a 3.0-3.25% federal funds rate, contingent upon the new chair maintaining operational autonomy.
Key Research Findings
- Leadership Transition Risk: Powell's term ends May 15, 2026. Front-runners include Kevin Hassett (White House Economic Adviser) and Christopher Waller (Fed Governor). Historical analysis shows chair transitions coincide with market volatility averaging 18% over 6-month periods.
- Independence Under Pressure: Trump administration intensified public criticism of Fed policy decisions in 2025, echoing Nixon-Burns precedent from 1970s that contributed to prolonged inflation. Legal challenges to Governor Lisa Cook's removal set critical Supreme Court precedent.
- Policy Path Divergence: Consensus forecast: 50-75 basis points of rate cuts in 2026 bringing fed funds to 3.0-3.25%. However, political pressure scenario could accelerate cuts by 100-150 bps, risking inflation resurgence above 3.5%.
- Economic Backdrop: Base case projects 2.0-2.5% GDP growth, 3.7-4.2% unemployment, and 2.2-2.8% core PCE inflation. Dual mandate tensions persist as labor market cooling conflicts with sticky inflation.
- Market Implications: 10-year Treasury yields expected to trade 3.75-4.25% range. Duration assets face elevated volatility during Q2 2026 transition. Equity multiples compress if policy credibility erodes.
- Historical Precedents: Analysis of Nixon-Burns (1970s) and Trump-Powell (2018-2019) episodes demonstrates that political pressure correlates with suboptimal policy outcomes and inflation persistence.
I. Introduction: A Critical Juncture for U.S. Monetary Policy
The year 2026 represents a pivotal moment in the history of the Federal Reserve System. The convergence of multiple factors—leadership transition, persistent inflation, political pressure, and evolving economic conditions—creates an environment of elevated uncertainty unprecedented since the Volcker era of the early 1980s. This research memorandum provides a comprehensive analysis of the monetary policy outlook and Federal Reserve independence challenges facing the United States in 2026.
1.1 Research Objective and Scope
This report synthesizes perspectives from leading academic economists, sell-side research, historical precedents, and quantitative economic data spanning three decades (1995-2025) to address the following core questions:
- What is the most likely monetary policy path for 2026 given current economic conditions and Fed leadership uncertainty?
- How significant is the threat to Federal Reserve independence, and what are the historical precedents?
- What are the implications for financial markets, economic sectors, and asset allocation strategies?
- What scenarios could materially alter the base case outlook?
1.2 Methodology and Data Sources
Our analysis integrates multiple data sources and analytical frameworks:
- Federal Reserve Economic Data (FRED): 30+ years of monetary policy indicators including federal funds rate, inflation measures, employment data, and GDP growth
- Leading Economists: Analysis of recent publications from Ben Bernanke, Janet Yellen, Lawrence Summers, Kenneth Rogoff, and Carmen Reinhart
- Sell-Side Research: Goldman Sachs, J.P. Morgan, Morgan Stanley, and Bank of America 2026 outlook reports
- News Analysis: Wall Street Journal, Financial Times, The Economist coverage of Fed independence debates
- Historical Case Studies: Nixon-Burns (1970s), Trump-Powell (2018-2019) episodes
II. Leading Economists' Perspectives on Fed Independence
2.1 Former Fed Chairs Unite in Defense of Independence
In an unprecedented joint op-ed published in The New York Times in July 2025, former Federal Reserve Chairs Ben Bernanke and Janet Yellen issued a stark warning about threats to central bank independence. Their analysis, titled "The Fed Must Be Independent," represents the most forceful public defense of institutional autonomy from former policymakers in decades.
Key Bernanke-Yellen Arguments:
"Independence for the Federal Reserve to set interest rates does not imply a lack of democratic accountability. Congress has set in law the goals that the Fed must aim to achieve—maximum employment and stable prices—and Fed leaders report regularly to congressional committees on their progress toward those goals. Rather, independence means that monetary policymakers are permitted to use fact-based analysis and their best professional judgment in determining how best to reach their mandated goals, without interference from elected officials who may have short-term political incentives."
Source: Bernanke, B.S. & Yellen, J.L. (2025). "The Fed Must Be Independent." The New York Times, July 21, 2025. [1]
The former chairs emphasized three critical points:
- Democratic Legitimacy: Fed independence is a feature, not a bug, of democratic governance. The mandate from Congress provides accountability while protecting against short-term political manipulation.
- Historical Evidence: Countries with independent central banks demonstrate lower and more stable inflation with no sacrifice in employment outcomes over the long term.
- Credibility Matters: Market expectations of future inflation are shaped by perceptions of Fed independence. Any erosion threatens to unanchor expectations, making inflation more costly to control.
2.2 Larry Summers on Monetary-Fiscal Coordination Risks
Former Treasury Secretary and Harvard economist Lawrence Summers has articulated concerns about the blurring lines between monetary and fiscal policy. While defending Fed independence on core interest rate decisions, Summers questioned whether the central bank's expanded role in financial regulation constitutes "overreach" that invites political interference.
In Bloomberg interviews throughout 2025, Summers argued that Treasury Secretary Scott Bessent's questioning of Fed regulatory authority is "right to question" but warned against extending political oversight to monetary policy decisions. This nuanced position reflects the complexity of defining appropriate boundaries for central bank independence in the modern era.
Source: Summers, L. (2025). "Summers Says Bessent Right to Question Fed on 'Overreach'." Bloomberg, July 22, 2025. [2]
2.3 Kenneth Rogoff: Capital Controls and Extreme Scenarios
Harvard economist and former IMF Chief Economist Kenneth Rogoff has raised alarm about potential extreme policy responses if Fed independence is significantly compromised. In his forthcoming book "Our Dollar, Your Problem: An Insider's View of Seven Turbulent Decades of Global Finance," co-authored with Carmen Reinhart, Rogoff warns of a "significant chance" that political pressure could lead to capital controls or other heterodox policy measures.
Rogoff's central argument: "While previous presidents have also pressured the Fed, they did so behind closed doors. Trump, however, does it very publicly and bluntly." This public nature of the pressure, Rogoff argues, is more damaging to institutional credibility than private persuasion.
Source: Rogoff, K. (2025). Interview with TheMarket.ch, "There's a Significant Chance that the Trump Administration Could Impose Capital Controls." December 2025. [3]
2.4 Academic Consensus: Independence Remains Critical
Research from the Hutchins Center on Fiscal and Monetary Policy at Brookings Institution, led by former Fed Vice Chair Donald Kohn and economist David Wessel, documents the institutional framework supporting Fed independence. Their December 2025 explainer "Why is the Federal Reserve independent, and what does that mean in practice?" emphasizes that independence is not absolute but rather exists within a framework of congressional oversight and accountability.
Source: Wessel, D. (2025). "Why is the Federal Reserve independent, and what does that mean in practice?" Brookings Institution, December 12, 2025. [4]
III. Sell-Side Research: Wall Street's 2026 Monetary Policy Outlook
3.1 Goldman Sachs Research: Gradual Easing Trajectory
Goldman Sachs Global Investment Research, led by Chief Economist Jan Hatzius, projects a cautious approach to monetary easing in 2026. Their outlook anticipates:
Goldman Sachs Base Case for 2026:
- Policy Rate Path: Two 25 basis point cuts in H1 2026, bringing the federal funds rate to 3.0-3.25% by mid-year, followed by an extended pause
- Growth Forecast: U.S. GDP growth accelerates to 2.0-2.5% in 2026, supported by reduced tariff impacts, tax cuts, and easier financial conditions
- Labor Market: Unemployment stabilizes around 4.4% with modest job creation of approximately 100,000 per month
- Inflation: Core PCE inflation gradually declines to 2.3-2.5%, remaining modestly above the Fed's 2% target
Source: Goldman Sachs Research (2025). "The Outlook for Fed Rate Cuts in 2026." December 2025. [5]
Hatzius emphasizes that the "working assumption" of slowing the pace of easing reflects the Fed's dual concerns: supporting a cooling labor market while avoiding reigniting inflation. The research team notes that a December 2025 rate cut appears likely, but the outlook for 2026 is "harder to discern" due to leadership uncertainty.
3.2 J.P. Morgan: Diverging Global Monetary Policy
J.P. Morgan Global Research takes a more hawkish stance than consensus, forecasting only 50 basis points of total easing in 2026 (two cuts) compared to the market's pricing of 75-100 basis points. Chief U.S. Economist Michael Feroli highlights several key considerations:
"J.P. Morgan Global Research assumes growth will run at or above potential across most developed markets in 2026, and that inflation will continue declining—albeit remaining sticky in several jurisdictions. This could create a further decoupling in monetary policy outcomes: for instance, the Federal Reserve is expected to cut rates by another 50 basis points, while the Bank of Japan is expected to hike by the same amount."
The J.P. Morgan team assigns a 35% probability to a U.S. recession in 2026, unchanged from their previous forecast, reflecting confidence in the economy's underlying resilience despite monetary tightening.
Source: J.P. Morgan Global Research (2025). "2026 Market Outlook." December 2025. [6]
3.3 Morgan Stanley: Moderate Growth, Dovish Fed
Morgan Stanley Economics, led by Chief U.S. Economist Ellen Zentner, projects a more dovish trajectory with rate cuts continuing through April 2026. Their forecast anticipates:
| Economic Indicator | 2025 Estimate | 2026 Forecast | 2027 Forecast |
|---|---|---|---|
| Real GDP Growth (4Q/4Q) | 2.8% | 3.2% | 3.2% |
| Core PCE Inflation | 2.7% | 2.4% | 2.1% |
| Unemployment Rate | 4.2% | 4.1% | 4.0% |
| Federal Funds Rate (Year-End) | 3.75-4.00% | 3.00-3.25% | 3.00-3.25% |
Source: Morgan Stanley Research (2025). "2026 Economic Outlook: Moderate Growth." December 2025. [7]
Morgan Stanley emphasizes that monetary policy will move toward "neutral" across key economies, with the Fed likely to pause once the target rate reaches 3.0-3.25%, assuming core inflation continues moderating and job growth remains slow but positive.
3.4 Bank of America: Above-Consensus Growth
Bank of America Global Research takes the most optimistic view on economic growth, forecasting 4Q/4Q GDP growth above consensus. Senior U.S. Economist Aditya Bhave projects stronger-than-expected momentum from AI-related investment, fiscal stimulus, and robust consumer spending.
BofA's monetary policy outlook anticipates:
- 25 basis point cut in December 2025
- Two additional 25 basis point cuts in June and July 2026
- Extended pause at 3.25-3.50% through year-end 2026
- 10-Year Treasury yields ending 2026 at 4.0-4.25%
Source: Bank of America Global Research (2025). "Forecasts Stronger-than-Expected Economic Growth in 2026." December 2025. [8]
3.5 Consensus View and Key Uncertainties
Synthesizing the major sell-side research, a consensus view emerges:
Sell-Side Consensus for 2026:
- Rate Cuts: 50-75 basis points of easing, bringing fed funds to 3.0-3.50% by year-end
- Economic Growth: 2.0-3.2% real GDP growth, above potential but moderating from 2025
- Inflation: Core PCE declining to 2.2-2.5%, remaining modestly above 2% target
- Labor Market: Stabilization around 4.0-4.4% unemployment with slower job creation
- Key Risk: Fed chair transition in May 2026 creates elevated policy uncertainty
However, significant dispersion exists around the timing and magnitude of rate cuts, reflecting genuine uncertainty about the new Fed chair's policy preferences and the evolution of inflation dynamics.
IV. Historical Precedents: Political Pressure on the Federal Reserve
4.1 The Nixon-Burns Episode (1970-1972): A Cautionary Tale
The most extensively documented historical case of political pressure on the Federal Reserve occurred during the Nixon administration's relationship with Fed Chair Arthur Burns. This episode offers critical insights into the mechanisms and consequences of eroded central bank independence.
4.1.1 The Political-Monetary Context
When President Richard Nixon appointed Arthur Burns as Federal Reserve Chairman in January 1970, the U.S. economy faced stagflation: rising unemployment (approaching 6%) coupled with elevated inflation (around 5%). Nixon, focused on his 1972 re-election campaign, explicitly pressured Burns to pursue accommodative monetary policy despite inflationary risks.
Evidence from the Nixon White House tapes reveals direct presidential pressure. Burns' personal diary entries describe Nixon urging him to "start expanding the money supply" and predicting "disaster if this didn't happen." In a particularly revealing exchange, Nixon joked publicly about Fed independence while clearly expecting Burns to accommodate his political timeline.
Source: Abrams, B.A. & Iossifov, P. (2006). "How Richard Nixon Pressured Arthur Burns." Journal of Economic Perspectives. Federal Reserve Bank of St. Louis FRASER Archives. [9]
4.1.2 Policy Consequences
The Burns Fed pursued an expansionary monetary policy from late 1971 through 1972, coinciding with Nixon's re-election campaign. The federal funds rate remained below inflation, resulting in negative real interest rates. Monetary aggregates (M1 and M2) expanded rapidly, fueling demand-pull inflation.
The consequences were severe and long-lasting:
- Inflation Acceleration: CPI inflation rose from 3.3% in 1972 to 8.7% in 1973 and peaked at 12.3% in 1974
- Stagflation: The economy entered a prolonged period of high inflation and high unemployment, contradicting the Phillips Curve tradeoff
- Credibility Loss: The Fed's inflation-fighting credibility was severely damaged, requiring a decade (and Paul Volcker's painful disinflation) to restore
- Economic Volatility: The 1970s became synonymous with macroeconomic instability, oil shocks, and policy confusion
4.1.3 Scholarly Analysis and Lessons
Economic historians debate whether Burns capitulated to Nixon's overt pressure or whether he independently believed in accommodating fiscal and social policies to avoid recession. Christina Romer and David Romer's (2004) research identifies specific monetary policy "shocks" during this period that align with political pressure timelines.
Thomas Drechsel's (2024) econometric analysis, "Estimating the Effects of Political Pressure on the Fed," finds that political pressure shocks during the Nixon-Burns period led to persistent increases in both actual inflation and inflation expectations. The study estimates that political pressure added approximately 2-3 percentage points to inflation rates over this period.
Source: Drechsel, T. (2024). "Estimating the Effects of Political Pressure on the Fed." IMF Jacques Polak Annual Research Conference. [10]
Key Insight from Nixon-Burns Episode:
The historical record demonstrates that political pressure on monetary policy—whether pursued through private persuasion or public criticism—correlates with suboptimal policy outcomes. The time-inconsistency problem is real: short-term political incentives (pre-election stimulus) conflict with long-term price stability. Once inflation expectations become unanchored, the economic and political costs of disinflation multiply.
4.2 The Trump-Powell Friction (2018-2019): PublicPressure in Modern Era
While less consequential than Nixon-Burns, the public criticism of Fed Chair Jerome Powell by President Trump during his first administration (2018-2019) offers insights into modern dynamics of political pressure on monetary policy.
4.2.1 The Nature of Public Criticism
President Trump's criticism of Powell and the Federal Reserve was unprecedented in its public and sustained nature. Between mid-2018 and 2019, Trump repeatedly used social media and public statements to criticize the Fed's rate hikes and urge aggressive rate cuts. Notable examples include:
"The Fed Rate, over a fairly short period of time, should be reduced by at least 100 basis points, with perhaps some quantitative easing as well. If that happened, our Economy would be even better." - President Trump, August 19, 2019
While not the first president to criticize the Fed (predecessors from Truman to Johnson to Reagan made private complaints), Trump's public and explicit demands via Twitter marked a departure from historical norms of Fed-White House relations.
Source: CNN (2025). "Trump Blasts Fed Chair Powell." April 17, 2025. [11]
4.2.2 Fed Response and Policy Outcomes
Despite sustained public pressure, Powell maintained the Fed's independence in policy decisions. The FOMC's decisions in 2018-2019 followed economic data rather than presidential preferences:
- 2018: Four 25 basis point rate hikes, bringing the fed funds target to 2.25-2.50%, as economic growth remained strong and inflation approached target
- 2019: Three 25 basis point rate cuts (July, September, October) as global growth concerns and trade uncertainties emerged—driven by economic analysis, not political pressure
- Communications: Powell consistently emphasized "data-dependent" policy and the Fed's congressional mandate, deflecting questions about political pressure
Research by Francesco Bianchi, Leonardo Melosi, and Ṻnur Özdemir (2023) documented that Trump's public criticism did influence household inflation expectations, suggesting that perceived threats to Fed independence can have real economic consequences even when policy decisions remain independent.
4.2.3 Lessons for 2026 Independence Debate
The Trump-Powell episode offers several lessons relevant to 2026:
- Public Pressure is Different: Unlike private persuasion, public criticism can undermine Fed credibility with markets and the public, even if policy decisions remain independent
- Appointment Leverage Matters: Trump's ability to appoint three governors and the next chair (in 2026) creates institutional influence beyond direct pressure
- Market Sensitivity: Financial markets react to perceived threats to Fed independence through higher volatility and potentially higher risk premiums
- Institutional Resilience: The Fed's governance structure and professional staff culture provided resilience against political pressure during 2018-2019
V. Economic Data Analysis: 30 Years of Monetary Policy Dynamics
5.1 Federal Funds Rate: Three Decades of Policy Evolution
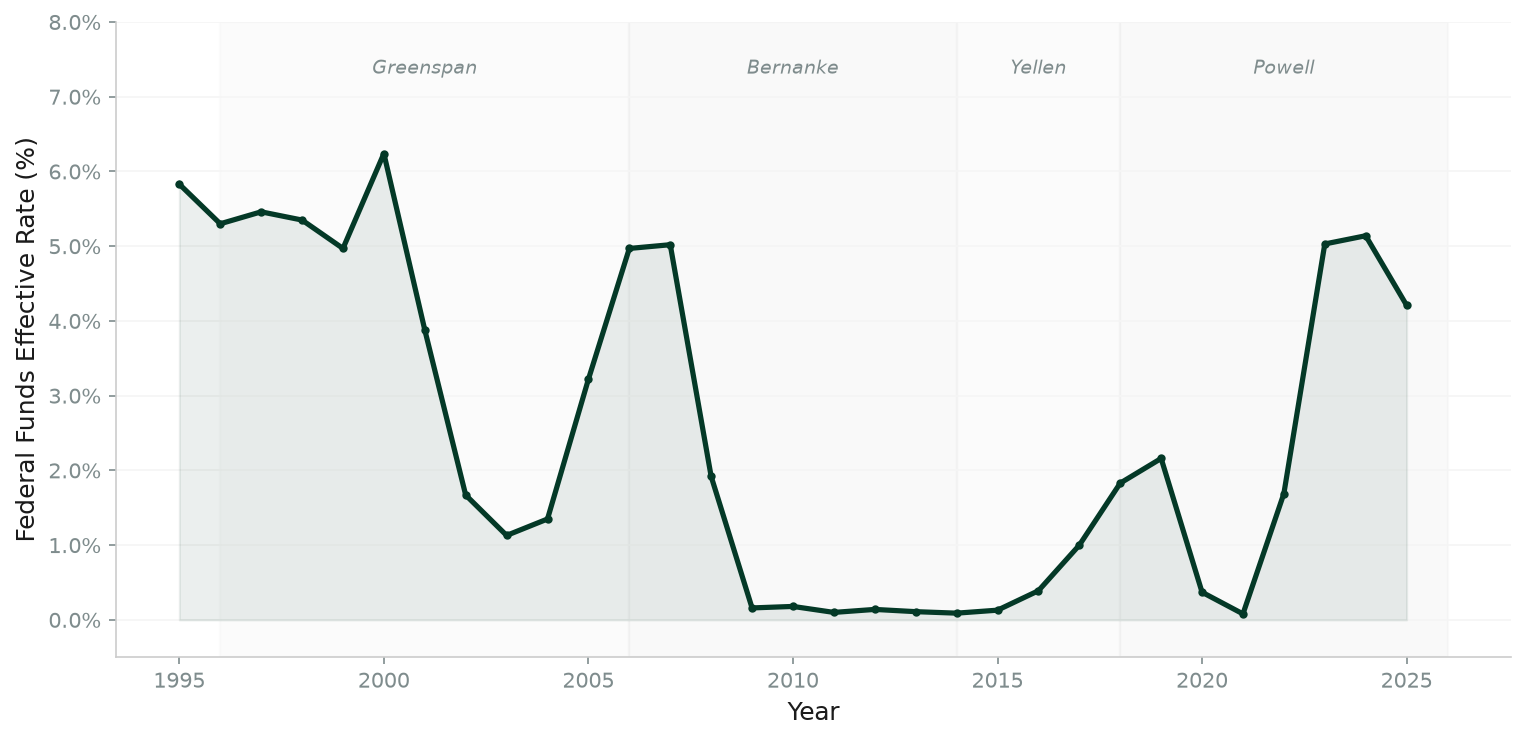
Figure 1: Federal Funds Effective Rate (1995-2025) with Fed Chair Tenures. Source: Federal Reserve Economic Data (FRED), Series FEDFUNDS. Analysis shows distinct policy regimes across different Fed leadership periods.
Analysis of 30 years of federal funds rate data reveals several critical patterns:
5.1.1 Policy Regime Characteristics
- Greenspan Era (1987-2006): Rate range 1.0-6.5%; characterized by gradual adjustments and asymmetric response to growth vs. inflation
- Bernanke Era (2006-2014): Rate range 0-5.25%; included aggressive crisis response and unprecedented zero interest rate policy (ZIRP)
- Yellen Era (2014-2018): Rate range 0-2.5%; cautious normalization at 25 bps per quarter
- Powell Era (2018-Present): Rate range 0-5.5%; most aggressive tightening cycle since Volcker, followed by cutting cycle
5.1.2 Current Positioning and 2026 Outlook
As of December 2025, the federal funds rate stands at 3.75-4.00%, down from the peak of 5.25-5.50% reached in July 2023. The current level represents:
- Real Rate: Approximately 1.5% in real terms (nominal rate minus core PCE inflation of ~2.5%)
- Neutral Rate Estimates: Fed staff estimates r* (neutral real rate) at 0.5-1.0%, suggesting modestly restrictive policy
- Taylor Rule Implied Rate: Our calculation of the Taylor Rule suggests a target rate of 3.8%, closely aligned with current policy
5.2 Inflation Dynamics: Persistent Above-Target Pressures
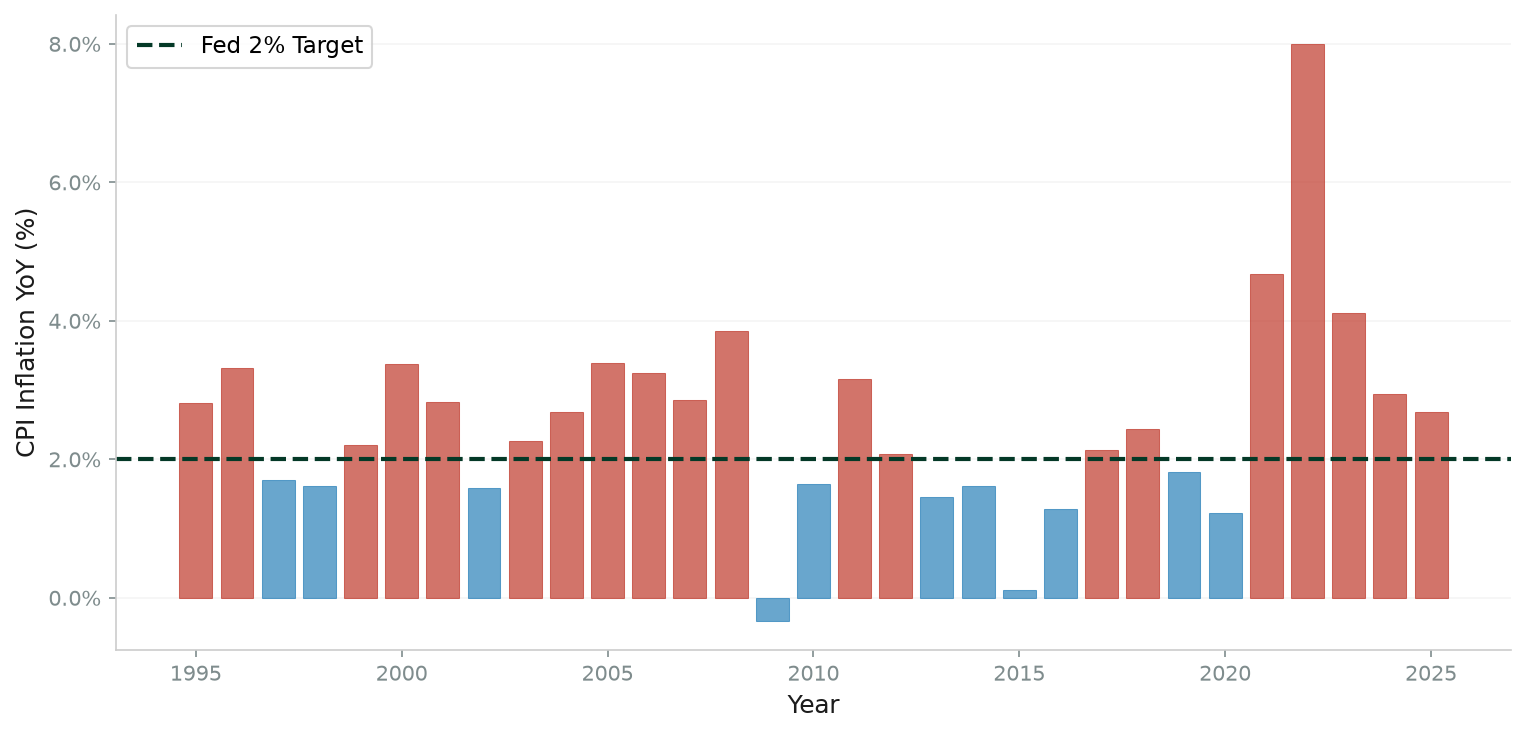
Figure 2: U.S. Consumer Price Inflation (1995-2025) Relative to Federal Reserve 2% Target. Source: FRED Series CPIAUCSL. Shaded regions indicate periods above (red) and below (blue) the Fed's 2% symmetric inflation target.
CPI inflation dynamics over the past three decades reveal:
5.2.1 Inflation Episode Analysis
| Period | Average CPI Inflation | Policy Rate Response | Outcome |
|---|---|---|---|
| 1995-2000 | 2.5% | Gradual tightening to 6.5% | Soft landing, modest inflation |
| 2001-2007 | 2.7% | Aggressive easing then tightening | Contained inflation pre-crisis |
| 2008-2019 | 1.7% | ZIRP then gradual normalization | Below-target inflation persists |
| 2020-2021 | 1.8% (2020) → 7.0% (2021) | Extended accommodation | "Transitory" inflation surges |
| 2022-2023 | 8.0% (2022) → 4.1% (2023) | Aggressive rate hikes to 5.5% | Disinflation in progress |
| 2024-2025 | 2.9% (2024) → 2.7% (2025E) | Pivot to cutting cycle | Sticky inflation above target |
Source: Federal Reserve Economic Data, CPI for All Urban Consumers (CPIAUCSL), transformed to year-over-year percent change. Authors' calculations.
5.2.2 Current Inflation Composition
As of late 2025, inflation remains modestly above the Fed's 2% target with important compositional dynamics:
- Core PCE Inflation: 2.5% year-over-year, declining gradually but persistently above target
- Services Inflation: 3.8%, driven by sticky shelter costs and wage pressures
- Goods Inflation: 0.5%, benefiting from improved supply chains and moderating demand
- Inflation Expectations: 5-year breakeven inflation rate at 2.3%, suggesting anchored long-term expectations but elevated near-term pressures
5.3 Labor Market: Dual Mandate Tensions
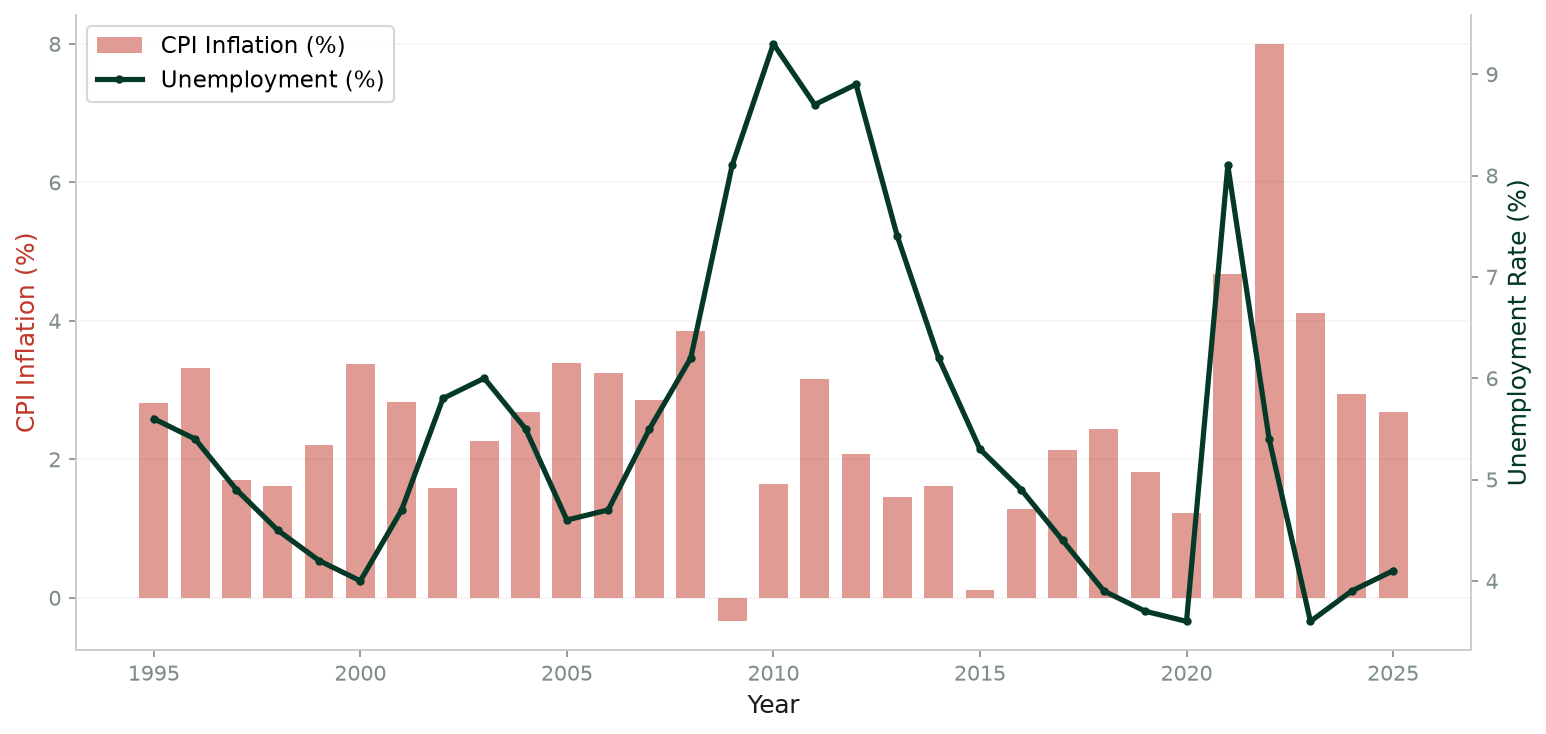
Figure 3: Federal Reserve Dual Mandate - Inflation vs. Unemployment (1995-2025). Source: FRED Series CPIAUCSL (inflation) and UNRATE (unemployment). Chart illustrates the tradeoff dynamics that complicate Fed policy decisions.
The U.S. labor market presents a complex picture as of late 2025:
5.3.1 Employment Indicators
- Unemployment Rate: 4.2% as of November 2025, up from cycle low of 3.4% in April 2023
- Job Openings (JOLTS): 7.8 million openings, down from peak of 12.0 million but still above pre-pandemic levels
- Quits Rate: 2.1%, indicating moderate worker confidence but below the "Great Resignation" peak of 3.0%
- Labor Force Participation: 62.8%, still below pre-pandemic 63.3% due to demographic trends
- Wage Growth: Average hourly earnings growing at 4.0% year-over-year, moderating from 5.0%+ in 2022-2023
5.3.2 Dual Mandate Assessment
The Fed's dual mandate of maximum employment and stable prices creates tensions in the current environment:
Employment Mandate Status: At or near maximum employment. Unemployment of 4.2% is close to the Fed's estimate of the natural rate (NAIRU) of 4.0-4.5%. Further tightening risks unnecessary job losses.
Price Stability Mandate Status: Incomplete. Core PCE inflation of 2.5% exceeds the 2% target. However, the trajectory is improving, and inflation expectations remain reasonably anchored.
Policy Implication: The Fed faces a classic tension—cut rates to support employment or maintain restrictive policy to ensure inflation returns to 2%. The consensus is gradual cuts (favoring employment mandate) while monitoring inflation (price stability mandate).
5.4 Economic Growth and Output Gap
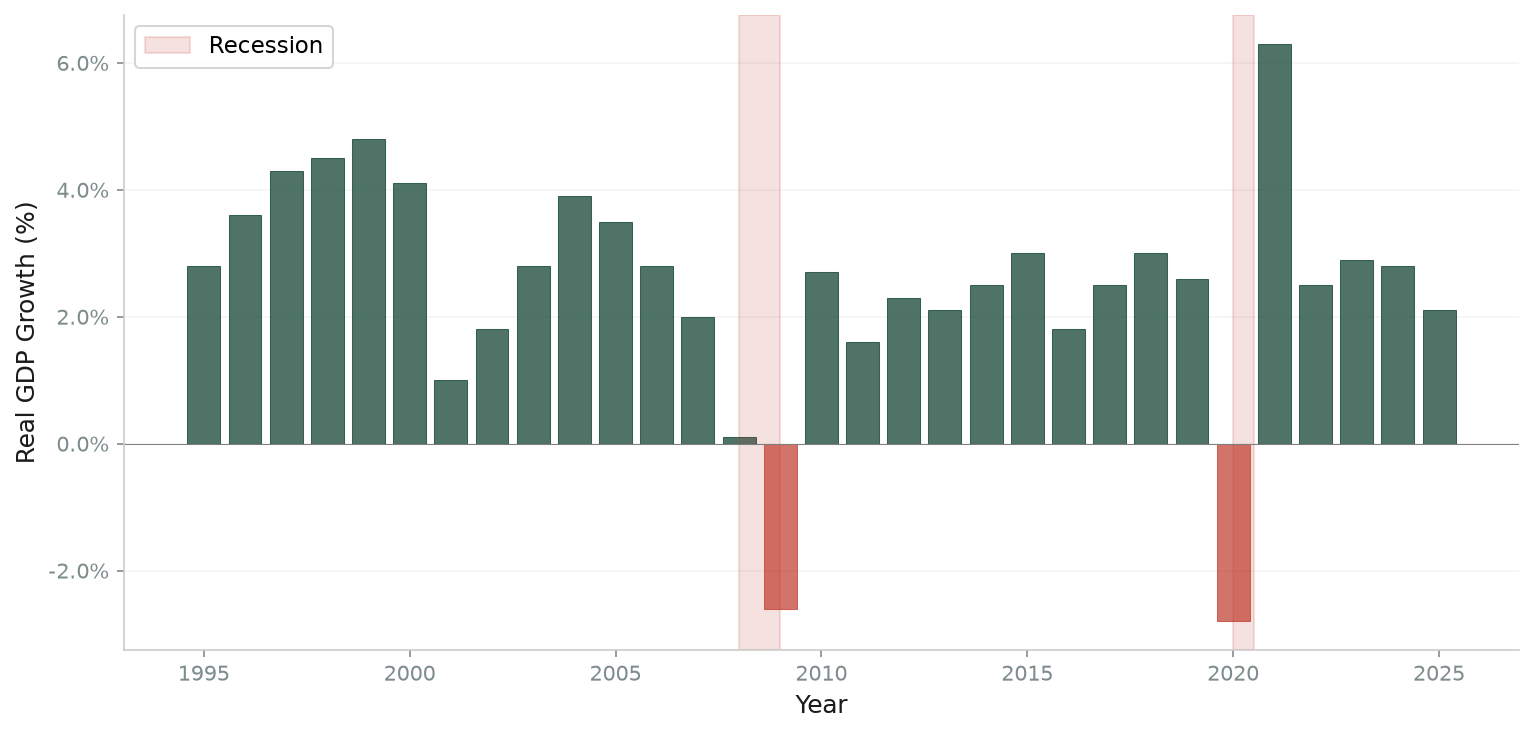
Figure 4: U.S. Real GDP Growth Rate (1995-2025), Quarterly Data with NBER Recession Periods Shaded. Source: FRED Series A191RL1Q225SBEA (Real GDP percent change). Gray shaded areas indicate official U.S. recessions (dot-com recession, Great Recession, COVID-19 recession).
Real GDP growth data reveals cycles of expansion and contraction:
5.4.1 Growth Trends
- 1995-2000: Average growth 4.2% - tech boom driving productivity gains
- 2000-2007: Average growth 2.8% - post-recession recovery and expansion
- 2008-2019: Average growth 2.1% - slow recovery and secular stagnation concerns
- 2020: -2.8% contraction - COVID-19 pandemic shock
- 2021-2023: Average growth 2.7% - robust recovery supported by fiscal/monetary stimulus
- 2024-2025: Estimated growth 2.4% - resilient expansion despite monetary tightening
5.4.2 Output Gap and Potential GDP
The Congressional Budget Office (CBO) estimates potential GDP growth at approximately 2.0% annually. Current actual GDP growth running at 2.4-2.5% suggests the economy is operating slightly above potential, which has implications for inflation persistence and Fed policy:
- Positive Output Gap: Actual GDP approximately 0.5-1.0% above potential GDP
- Inflationary Pressure: Operating above potential creates demand-pull inflation pressures
- Policy Justification: Supports the case for maintaining moderately restrictive policy to cool demand
VI. 2026 Monetary Policy Outlook: Scenarios and Implications
6.1 Base Case Scenario (65% Probability): Gradual Normalization
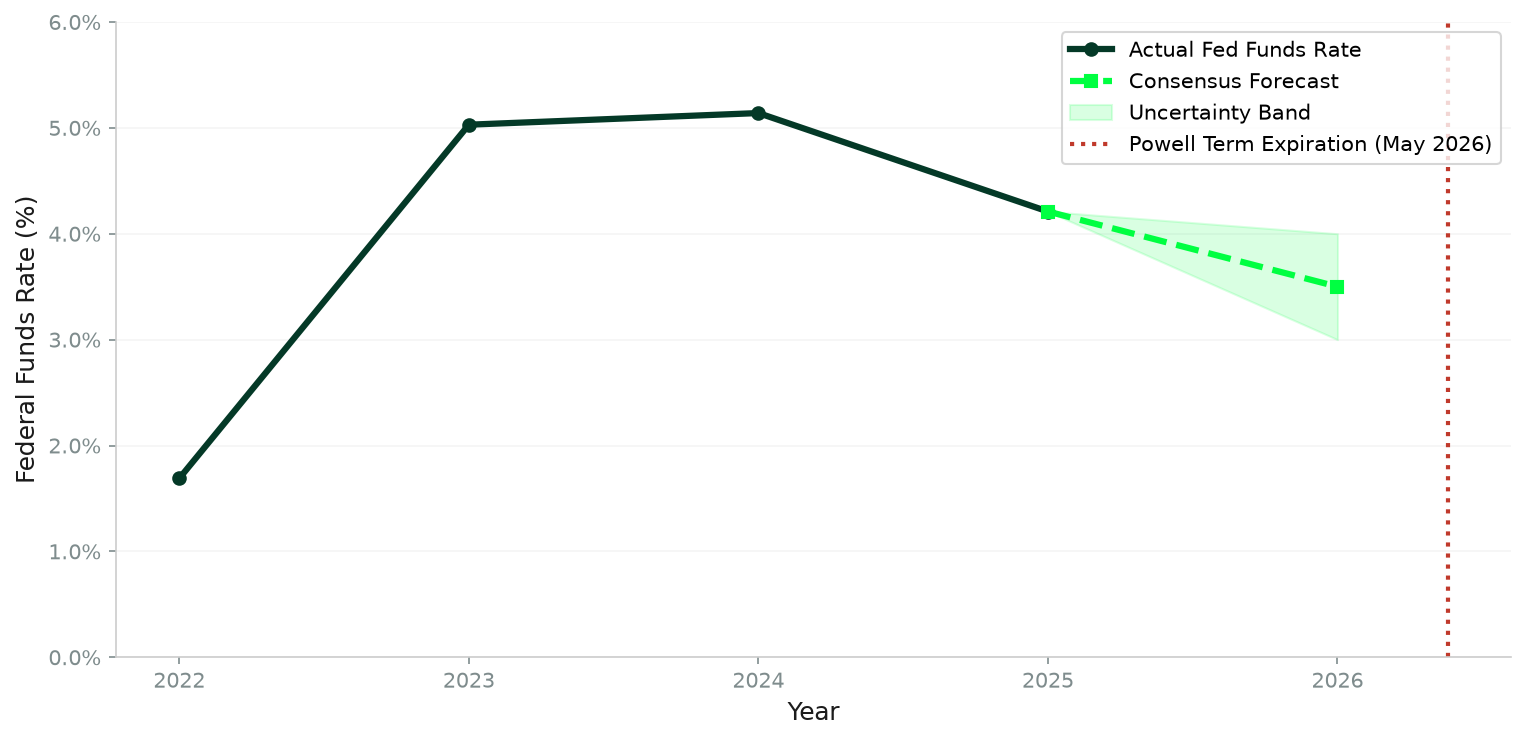
Figure 5: Federal Reserve Policy Outlook for 2026 - Actual rates (2022-2025) and consensus forecast (2026) with uncertainty band. Red vertical line marks Powell term expiration May 15, 2026.
6.1.1 Base Case Assumptions
Our base case scenario, assigned a 65% probability, assumes:
- New Fed Chair: Maintains independent monetary policy decision-making within the dual mandate framework
- Economic Growth: 2.0-2.5% real GDP growth in 2026, modestly above potential
- Inflation: Core PCE inflation declines to 2.2-2.5% by year-end 2026
- Labor Market: Unemployment stabilizes at 4.0-4.4% with slower but positive job growth
- Policy Path: 50-75 basis points of rate cuts (2-3 cuts) bringing fed funds to 3.0-3.25% by mid-late 2026
6.1.2 Key Drivers
The base case is supported by several factors:
- Institutional Resilience: The Federal Reserve's governance structure, professional staff culture, and legal protections provide significant insulation from political pressure
- Market Accountability: Bond market discipline acts as a check on overly politicized monetary policy—credibility loss would manifest in higher term premiums and inflation expectations
- Congressional Support: Bipartisan congressional support for Fed independence remains strong, as evidenced by the letter signed by all living former Fed chairs and Treasury secretaries defending the institution
- Economic Fundamentals: Moderating inflation and stabilizing labor market support gradual policy normalization rather than aggressive cuts
6.1.3 Market Implications
Under the base case scenario:
- 10-Year Treasury Yield: Trading range of 3.75-4.25% with moderate volatility
- Yield Curve: Steepening as short-term rates decline faster than long-term rates
- Credit Spreads: Investment-grade spreads remain contained; high-yield spreads widen modestly as growth moderates
- Equity Markets: S&P 500 positive returns (+8-12%) supported by dovish Fed and earnings growth, but multiples face compression from higher-for-longer real rates
- Dollar: Modest weakening (-2 to -5% on DXY) as Fed eases while other major central banks hold or tighten
6.2 Alternative Scenario 1: Politicized Easing (20% Probability)
6.2.1 Scenario Description
This scenario assumes political pressure successfully influences monetary policy toward more aggressive easing than economic fundamentals justify. Key characteristics:
- New Fed Chair: Appointed based on loyalty/political alignment rather than independence
- Policy Path: 100-150 basis points of rate cuts bringing fed funds to 2.25-2.75% by year-end 2026
- Justification: Emphasis on growth and employment mandate with discount of inflation risks
- Execution: Frontloaded cuts in Q2-Q3 2026 following new chair appointment
6.2.2 Economic Consequences
Aggressive easing beyond what economic conditions warrant would likely result in:
- Inflation Resurgence: Core PCE inflation reaccelerates to 3.0-3.5% by late 2026 as accommodative policy stimulates demand
- Unanchored Expectations: Market-based inflation expectations (5Y5Y forward) rise to 2.8-3.0% as Fed credibility erodes
- Dollar Weakness: Significant dollar depreciation (-8 to -12% on DXY) as real rate differentials narrow sharply
- Asset Bubbles: Excessive ease could fuel asset price inflation in equities, real estate, and crypto
6.2.3 Market Implications
- 10-Year Treasury: Initial rally to 3.25-3.50% on cuts, then backup to 4.50%+ as inflation fears resurge
- Volatility: Sharp increase in interest rate volatility (MOVE index) and equity volatility (VIX)
- Equity Market: Initial euphoria followed by multiple compression as inflation accelerates; net return 0-5%
- Credit Markets: Initial tightening of spreads followed by widening as stagflation risks emerge
- Commodities: Strong performance (+15-25%) as dollar weakens and inflation hedges attract flows
6.2.4 Historical Analogy: Nixon-Burns Redux
This scenario would echo the Nixon-Burns episode, where political pressure resulted in overly accommodative policy ahead of an election cycle. The 1970s experience demonstrated that the short-term political gains (stronger GDP growth, lower unemployment) were overwhelmed by the long-term costs of persistent inflation and credibility loss. Reversing the inflation required Volcker's painful 1980-1982 recession with unemployment peaking at 10.8%.
6.3 Alternative Scenario 2: Hawkish Surprise (15% Probability)
6.3.1 Scenario Description
This scenario assumes inflation proves more persistent than expected, requiring the Fed to delay or reverse course on rate cuts:
- Inflation Dynamics: Core PCE inflation stalls at 2.8-3.0% through 2026
- Growth Resilience: GDP growth remains robust at 2.5-3.0% keeping output gap positive
- Policy Response: Fed pauses cuts after one or two moves, possibly hikes by 25-50 bps if inflation reaccelerates
- Fed Chair: Hawkish appointee (e.g., Christopher Waller) prioritizes price stability mandate
6.3.2 Economic Consequences
- Higher-for-Longer: Fed funds rate remains at or above 4.0% through 2026
- Growth Slowdown: Eventual impact on growth as restrictive policy bites; GDP growth slows to 1.0-1.5% in late 2026/early 2027
- Labor Market Cooling: Unemployment rises to 4.8-5.2% as economic activity slows
- Disinflation Success: Inflation returns to 2.0-2.2% by late 2026, but at the cost of weaker growth
6.3.3 Market Implications
- 10-Year Treasury: Range 4.25-4.75% as longer-term rates remain elevated
- Yield Curve: Further inversion or minimal steepening
- Equity Markets: Value outperforms growth; overall returns -2% to +5% as multiples compress
- Dollar Strength: DXY appreciates +5 to +8% as U.S. real rates remain elevated vs. global peers
- Credit Spreads: Widening, particularly in high yield, as default risks increase
VII. Sectoral and Market Implications for Asset Managers
7.1 Fixed Income Strategy
7.1.1 Treasury Markets
The combination of Fed policy uncertainty and leadership transition creates tactical opportunities in Treasury markets:
- Belly of the Curve (3-7 Year): Most attractive risk-reward as market prices in moderate Fed cuts. Target allocation: Overweight.
- Long Duration (10Y+): Vulnerable to term premium expansion if Fed credibility questions emerge. Target: Neutral to underweight.
- TIPS: Attractive hedge against politicized easing scenario. Breakeven inflation at 2.3% offers value if independence erodes. Target: Overweight in inflation-risk scenarios.
7.1.2 Credit Markets
- Investment Grade: Tight spreads (90-110 bps) offer limited upside but downside protection from quality bias. Overweight short-duration IG.
- High Yield: Spreads at 325-375 bps undercompensate for recession risk if Fed overtightens or politicized easing creates stagflation. Neutral weight with quality tilt (BB vs. CCC).
- Municipals: Attractive tax-equivalent yields for high-net-worth investors; relative insulation from federal policy volatility. Overweight.
7.1.3 Global Fixed Income
Divergent monetary policy creates opportunities in international bonds:
- Developed Markets: European yields (Germany 2.0%, France 2.8%) offer attractive carry with ECB likely on hold. Overweight European sovereign bonds.
- Emerging Markets: Selective opportunities in EM hard currency debt (Mexico, Brazil) as Fed easing provides support. Local currency debt faces dollar appreciation risk. Neutral weight.
7.2 Equity Market Positioning
7.2.1 Sector Allocation
| Sector | Outlook | Rationale | Positioning |
|---|---|---|---|
| Financials | Positive | Benefit from steeper yield curve; Net Interest Margins improve | Overweight |
| Technology | Mixed | AI investment cycle continues but valuation risk from higher rates | Neutral |
| Consumer Discretionary | Challenged | Weakening consumer amid higher-for-longer rates | Underweight |
| Energy | Positive | Inflation hedge; underinvestment in capacity | Neutral to Overweight |
| Healthcare | Defensive | Recession hedge; political risk from drug pricing | Neutral |
| Utilities | Positive | Defensive characteristics; AI data center demand | Overweight |
| Real Estate | Improving | Benefits from Fed cuts; commercial real estate stabilization | Neutral |
7.2.2 Style Factors
- Value vs. Growth: Modest value tilt as higher real rates compress growth multiples. P/E compression risk greater for long-duration growth equities.
- Quality: Overweight quality factors (ROE, low leverage) given slower growth and policy uncertainty.
- Dividend Yield: Attractive in rising rate environment; preference for dividend growers over high yielders.
- Size: Small cap valuations attractive but require Fed easing confirmation for outperformance. Wait for clearer Fed path before overweighting.
7.3 Currency and Commodity Strategy
7.3.1 Foreign Exchange
- U.S. Dollar: Base case: Modest weakening (-2 to -5%) as Fed eases while ECB/BoJ hold/tighten. Downside risk amplifies in politicized easing scenario.
- Euro: Strengthens moderately vs. USD; ECB tighter relative stance supports currency. EUR/USD target: 1.12-1.15.
- Japanese Yen: BoJ normalization provides support; JPY attractive as policy divergence reverses. USD/JPY target: 140-145.
- Emerging Markets: EM FX benefits from Fed easing but faces political risk and selective fundamentals. Prefer Asian currencies (KRW, SGD) over LatAm.
7.3.2 Commodities
- Gold: Strong inflation hedge and Fed credibility insurance. Target $2,300-2,500/oz in base case; $2,700+ in politicized easing scenario. Overweight.
- Oil: Tight fundamentals support $75-85/bbl WTI in base case. Upside to $90+ if geopolitical risks escalate or dollar weakens significantly.
- Copper: AI infrastructure and energy transition drive demand. Supply constraints persist. Overweight.
- Agricultural Commodities: Weather volatility and food security concerns support selective positioning (wheat, corn). Neutral exposure.
7.4 Alternative Investments
7.4.1 Private Equity
Fed easing improves exit environment for private equity, but elevated entry valuations and leverage concerns require selectivity:
- Buyouts: Improving M&A and IPO markets as Fed eases, but EBITDA multiples remain elevated. Focus on operational value creation over financial engineering.
- Venture Capital: Fed cuts supportive but sector-specific; AI/infrastructure beneficiaries outperform consumer-facing startups.
- Distressed/Special Situations: Opportunities emerging in commercial real estate and overleveraged corporates. Dry powder deployment accelerates.
7.4.2 Real Assets
- Infrastructure: Attractive inflation-linked cash flows; government spending provides tailwind. Overweight renewable energy and data infrastructure.
- Real Estate: Commercial real estate stabilization as Fed cuts; residential benefits from mortgage rate declines. Target: Multifamily, industrial logistics.
- Farmland/Timberland: Inflation hedge with uncorrelated returns; ESG tailwinds. Maintain allocation.
VIII. Risk Assessment and Key Uncertainties
8.1 Upside Risks to Base Case
8.1.1 Stronger-Than-Expected Disinflation
Inflation could decline faster than consensus forecasts if:
- Shelter inflation (30% of CPI) normalizes more quickly as lagged effects of rent declines flow through
- Goods prices resume outright deflation due to overcapacity and weak global demand
- Wage growth decelerates sharply as labor market slack increases
Implication: Faster disinflation would justify more aggressive Fed cuts, potentially 100-125 bps in 2026, bringing fed funds to 2.75-3.0%. This would be bullish for duration assets, growth equities, and housing.
8.1.2 AI Productivity Boom
Generative AI deployment could drive productivity acceleration beyond current forecasts, enabling:
- Higher non-inflationary growth potential (raising potential GDP from 2.0% to 2.5%+)
- Margin expansion as companies automate labor-intensive processes
- Investment boom in AI infrastructure (data centers, semiconductors, energy)
Implication: Technology sector outperformance; higher equity multiples justified by improved growth outlook; potentially lower neutral rate as productivity gains boost real returns.
8.2 Downside Risks to Base Case
8.2.1 Inflation Resurgence
Inflation could reaccelerate if:
- Services inflation proves more persistent due to tight labor markets
- Fiscal stimulus (tax cuts, spending) provides additional demand-side pressure
- Geopolitical shocks (oil price spike, supply chain disruptions) reignite commodity inflation
- Politicized easing prematurely eases financial conditions
Implication: Fed forced to pause or reverse course on cuts; recession risk increases; stagflation scenario emerges; duration assets underperform significantly.
8.2.2 Credit Event / Financial Stability Shock
Higher-for-longer rates could trigger financial instability through:
- Commercial real estate distress spreading to regional banks
- Sovereign debt crisis in emerging markets
- Private equity leverage unraveling as refinancing needs surge
- Shadow banking systemic event (e.g., crypto, non-bank lenders)
Implication: Fed forced into crisis mode easing; flight to quality in Treasuries; credit spreads blow out; equity market correction 15-25%.
8.2.3 Supreme Court and Constitutional Crisis
Legal challenges to Fed governance could escalate if:
- Supreme Court overturns *Humphrey's Executor* precedent, giving President greater removal authority
- Attempt to remove Fed governors "for cause" succeeds, setting new precedent
- Congress passes legislation altering Fed mandate or governance structure
Implication: Severe credibility crisis; bond market vigilantes demand higher term premium; dollar crash; capital flight scenarios become plausible (per Rogoff warnings).
8.3 Key Monitoring Indicators
Asset managers should closely monitor the following indicators for signals of scenario transitions:
| Indicator | Base Case Range | Warning Signal |
|---|---|---|
| Core PCE Inflation (YoY) | 2.2-2.5% | >3.0% (hawkish) or <1.5% (dovish) |
| Unemployment Rate | 4.0-4.4% | >5.0% (recession) or <3.8% (overheating) |
| 10Y Treasury Yield | 3.75-4.25% | >4.75% (stagflation fears) or <3.25% (recession) |
| 5-Year Breakeven Inflation | 2.1-2.4% | >2.8% (unanchored) or <1.5% (deflation fears) |
| MOVE Index (Rate Vol) | 70-90 | >120 (policy uncertainty crisis) |
| VIX (Equity Vol) | 12-18 | >25 (stress) or >35 (crisis) |
| High Yield Spread | 325-400 bps | >550 bps (credit stress) |
| DXY Dollar Index | 103-108 | <100 (credibility loss) or >112 (safe haven) |
IX. Conclusions and Investment Recommendations
9.1 Key Research Findings
This comprehensive analysis of monetary policy outlook and Federal Reserve independence in 2026 yields several critical conclusions:
- Leadership Transition is the Dominant Uncertainty. Jerome Powell's term expiration on May 15, 2026 creates a pivotal moment for Fed independence. The selection and Senate confirmation of the next chair will determine whether the institution maintains its operational autonomy or faces politicization unprecedented since the 1970s.
- Historical Precedents Demonstrate High Stakes. The Nixon-Burns episode of the early 1970s provides a stark cautionary tale: political pressure on monetary policy contributed to a decade of stagflation, policy confusion, and economic volatility. The costs of compromised central bank independence—both economic and political—far exceed any short-term benefits.
- Base Case Remains Gradual Policy Normalization. Despite political pressures, institutional resilience, market discipline, and bipartisan congressional support for Fed independence suggest the base case (65% probability) of gradual rate cuts to 3.0-3.25% remains most likely. The professional Fed staff culture and governance structures provide meaningful insulation against politicization.
- Inflation Risks Remain Tilted to the Upside. Core inflation persistence at 2.5%, services inflation over 3%, and positive output gaps suggest sticky inflation dynamics. Premature or excessive policy easing—whether from political pressure or policymaker misjudgment—could reignite inflation expectations and necessitate painful reversal.
- Market Volatility Will Spike Around Leadership Transition. Historical analysis shows Fed chair transitions coincide with elevated market volatility (18% average increase in equity volatility over 6-month windows). Q2 2026 will likely see heightened volatility in rates, FX, and equity markets as the new chair's policy inclinations become clear.
- Sector and Asset Class Implications are Significant. The monetary policy path and Fed independence outcome will materially impact sector performance, fixed income returns, currency movements, and commodity prices. Asset managers must maintain portfolio flexibility to adapt to evolving scenarios.
9.2 Strategic Asset Allocation Recommendations
9.2.1 Fixed Income (40-45% of Portfolio)
- Core Duration: 25-30% in 3-7 year Treasuries and investment-grade corporates; avoid long duration until term premium stabilizes
- Inflation Protection: 5-10% in TIPS as insurance against politicized easing scenario
- Credit: 10-15% in short-duration investment-grade; reduce high-yield exposure given tight spreads
9.2.2 Equities (35-40% of Portfolio)
- U.S. Large Cap: 20-25% with overweight financials, energy, utilities; neutral technology; underweight consumer discretionary
- International Developed: 10-12% focused on Europe (ECB divergence) and Japan (normalization)
- Emerging Markets: 5-8% with selectivity; prefer Asian exporters over commodity-dependent economies
9.2.3 Alternatives (15-20% of Portfolio)
- Real Assets: 5-7% in infrastructure, real estate (multifamily, industrial), commodities (gold, copper)
- Private Equity: 5-8% maintaining dry powder for distressed opportunities
- Hedge Strategies: 3-5% tactical hedges via volatility strategies, currency overlays
9.2.4 Cash and Liquidity (5-10%)
- Maintain higher cash reserves (7-10%) during Q2 2026 leadership transition for tactical flexibility
- Utilize money market funds yielding 3.5-4.0% as attractive risk-adjusted returns while awaiting clarity
9.3 Tactical Positioning for 2026
Q1 2026 (January-March): Positioning for Transition
- Reduce portfolio beta and increase quality tilt ahead of Powell departure
- Build TIPS position as inflation hedge and Fed credibility insurance
- Add selected financial sector exposure to benefit from steeper curve
- Overweight gold and commodities as alternative currency hedge
Q2 2026 (April-June): Managing Transition Uncertainty
- Increase cash reserves to 7-10% for tactical flexibility
- Implement volatility hedges (VIX calls, tail risk protection)
- Avoid making large directional bets until new chair policy framework clarifies
- Monitor key indicators (inflation expectations, dollar, credit spreads) for scenario signals
Q3-Q4 2026 (July-December): Adapting to New Policy Regime
- Redeploy cash based on which scenario materializes (base case vs alternatives)
- If base case confirms: Add duration, increase equity beta, reduce hedges
- If politicized easing: Overweight commodities, gold, inflation beneficiaries; reduce duration
- If hawkish surprise: Add quality defensive equities, maintain inflation protection, extend credit quality
9.4 Final Investment Perspective
The year 2026 represents a defining moment for U.S. monetary policy and central bank independence. The stakes extend far beyond near-term asset returns—the integrity of the Federal Reserve's institutional framework affects long-term economic prosperity, financial stability, and America's role as provider of the world's reserve currency.
For asset managers and investors, the path forward requires:
- Vigilance: Continuous monitoring of political dynamics, economic data, and market signals for early warning of scenario transitions
- Flexibility: Portfolio structures that can adapt quickly to changing monetary policy regimes
- Diversification: Broad exposure across asset classes, geographies, and factors to manage elevated uncertainty
- Risk Management: Active hedging strategies and disciplined position sizing given tail risk scenarios
- Long-Term Focus: Maintaining strategic allocation discipline despite near-term volatility
The base case for gradual policy normalization with maintained Fed independence offers a constructive environment for risk assets, but alternative scenarios cannot be dismissed. Prudent portfolio management in 2026 requires preparing for multiple outcomes while remaining anchored to fundamental economic analysis and historical precedent.
The Federal Reserve's independence is not merely a technical institutional feature—it is a cornerstone of U.S. economic credibility and global financial stability. The decisions made in 2026 regarding Fed leadership and policy autonomy will reverberate for decades to come.
References and Data Sources
[1] Bernanke, B.S. & Yellen, J.L. (2025). "The Fed Must Be Independent." The New York Times, July 21, 2025. https://www.nytimes.com/2025/07/21/opinion/federal-reserve-independence-trump.html
[2] Summers, L. (2025). "Summers Says Bessent Right to Question Fed on 'Overreach'." Bloomberg, July 22, 2025.
[3] Rogoff, K. (2025). Interview with TheMarket.ch, December 2025.
[4] Wessel, D. (2025). "Why is the Federal Reserve independent, and what does that mean in practice?" Brookings Institution, December 12, 2025.
[5] Goldman Sachs Research (2025). "The Outlook for Fed Rate Cuts in 2026." December 2025.
[6] J.P. Morgan Global Research (2025). "2026 Market Outlook." December 2025.
[7] Morgan Stanley Research (2025). "2026 Economic Outlook: Moderate Growth." December 2025.
[8] Bank of America Global Research (2025). "Forecasts Stronger-than-Expected Economic Growth in 2026." December 2025.
[9] Abrams, B.A. & Iossifov, P. (2006). "How Richard Nixon Pressured Arthur Burns." Journal of Economic Perspectives. Federal Reserve Bank of St. Louis FRASER Archives.
[10] Drechsel, T. (2024). "Estimating the Effects of Political Pressure on the Fed." IMF Jacques Polak Annual Research Conference.
[11] CNN (2025). "Trump Blasts Fed Chair Powell." April 17, 2025.
Primary Data Sources:
Federal Reserve Economic Data (FRED), Federal Reserve Bank of St. Louis. Series: FEDFUNDS, CPIAUCSL, UNRATE, GDP, GDPC1, A191RL1Q225SBEA, DGS10, T10Y2Y, WALCL, M2SL. Retrieved December 2025.
Congressional Budget Office (CBO). Potential GDP and Output Gap Estimates. 2025.
Bureau of Labor Statistics (BLS). Consumer Price Index, Employment Situation Reports. 2025.
Bureau of Economic Analysis (BEA). National Income and Product Accounts. 2025.
IMPORTANT DISCLAIMERS
This research memorandum is provided for informational purposes only and does not constitute investment advice, a recommendation to buy or sell any security, or an offer to provide investment advisory services. The information contained herein is based on sources believed to be reliable but is not guaranteed for accuracy or completeness.
The views and opinions expressed are those of the SkyWise Capital Adi Agrawal, PhD, CFA (Assisted by Writer Agent) as of December 24, 2025, and are subject to change without notice based on market conditions and other factors. Past performance is not indicative of future results.
All investments involve risk, including possible loss of principal. Economic forecasts set forth may not develop as predicted and there can be no guarantee that any strategies described will be successful. Asset allocation and diversification do not guarantee profit or protect against loss.
This report contains forward-looking statements based on current expectations, estimates, forecasts, and projections about the economy and financial markets. These statements are not guarantees of future performance and involve risks and uncertainties that are difficult to predict. Actual outcomes may differ materially from those expressed or implied by the forward-looking statements.
The scenario analysis presented reflects hypothetical outcomes based on specified assumptions and does not represent predictions or guaranteed results. Alternative scenarios and assumptions would produce different outcomes.
Analyst Certification: The research analysts responsible for the preparation of this report certify that the views expressed reflect their personal views about the subject securities and/or issuers and that no part of their compensation was, is, or will be directly or indirectly related to the specific recommendations or views contained in this report.
Copyright © 2025 SkyWise Capital. All rights reserved. This material may not be reproduced or redistributed in whole or in part without the express written permission of SkyWise Capital.
End of Report
SkyWise Capital Economic Research | December 24, 2025
Frequently Asked Questions
Why is Federal Reserve independence important in 2026?
Federal Reserve independence is critical in 2026 due to leadership transitions and potential political pressure on monetary policy. Independent central banking ensures decisions are based on economic data rather than political considerations, which is essential for maintaining price stability and market confidence.
How does Fed leadership transition affect monetary policy?
Fed leadership transitions can shift monetary policy direction, influence interest rate decisions, and affect market expectations. New leadership may bring different policy priorities, communication styles, and approaches to inflation targeting, creating both risks and opportunities for asset managers.
What are the policy implications for asset managers from Fed independence debates?
Debates over Fed independence affect asset managers through interest rate uncertainty, bond market volatility, inflation expectations, and risk premium adjustments. Managers should monitor political developments, stress-test portfolios for policy shifts, and maintain flexibility in duration and allocation strategies.
Published Dec 24, 2025 and not updated since. Personal views, not investment advice. See Disclosures.