
1. Motivation: The Limitations of Traditional Classifications
For decades, investors, policymakers, and analysts have relied on static country classifications—primarily Developed Markets (DM), Emerging Markets (EM), and Frontier Markets (FM)—to segment the global economy. While these labels provide a convenient shorthand, they suffer from fundamental limitations that can obscure critical economic distinctions and lead to suboptimal decision-making.
1.1 The Problem with Static Labels
Traditional classifications face several critical challenges:
- Arbitrary Boundaries: The distinction between DM and EM is often based on subjective criteria that do not reflect real-time economic conditions. For example, South Korea and Taiwan are still classified as emerging markets by some indices despite having GDP per capita and institutional quality exceeding many developed markets.
- Excessive Heterogeneity: The "Emerging Markets" category encompasses countries as diverse as China (GDP per capita: $13,136), Turkey ($13,867), and India ($2,731)—economies with vastly different growth trajectories, risk profiles, and structural characteristics.
- Slow to Adapt: Traditional classifications change infrequently, failing to capture rapid economic transformations. Countries experiencing significant economic shifts remain locked in outdated categories for years.
- One-Size-Fits-All: Static labels assume that all countries within a category behave similarly, ignoring critical differences in trade openness, institutional quality, fiscal health, and growth dynamics.
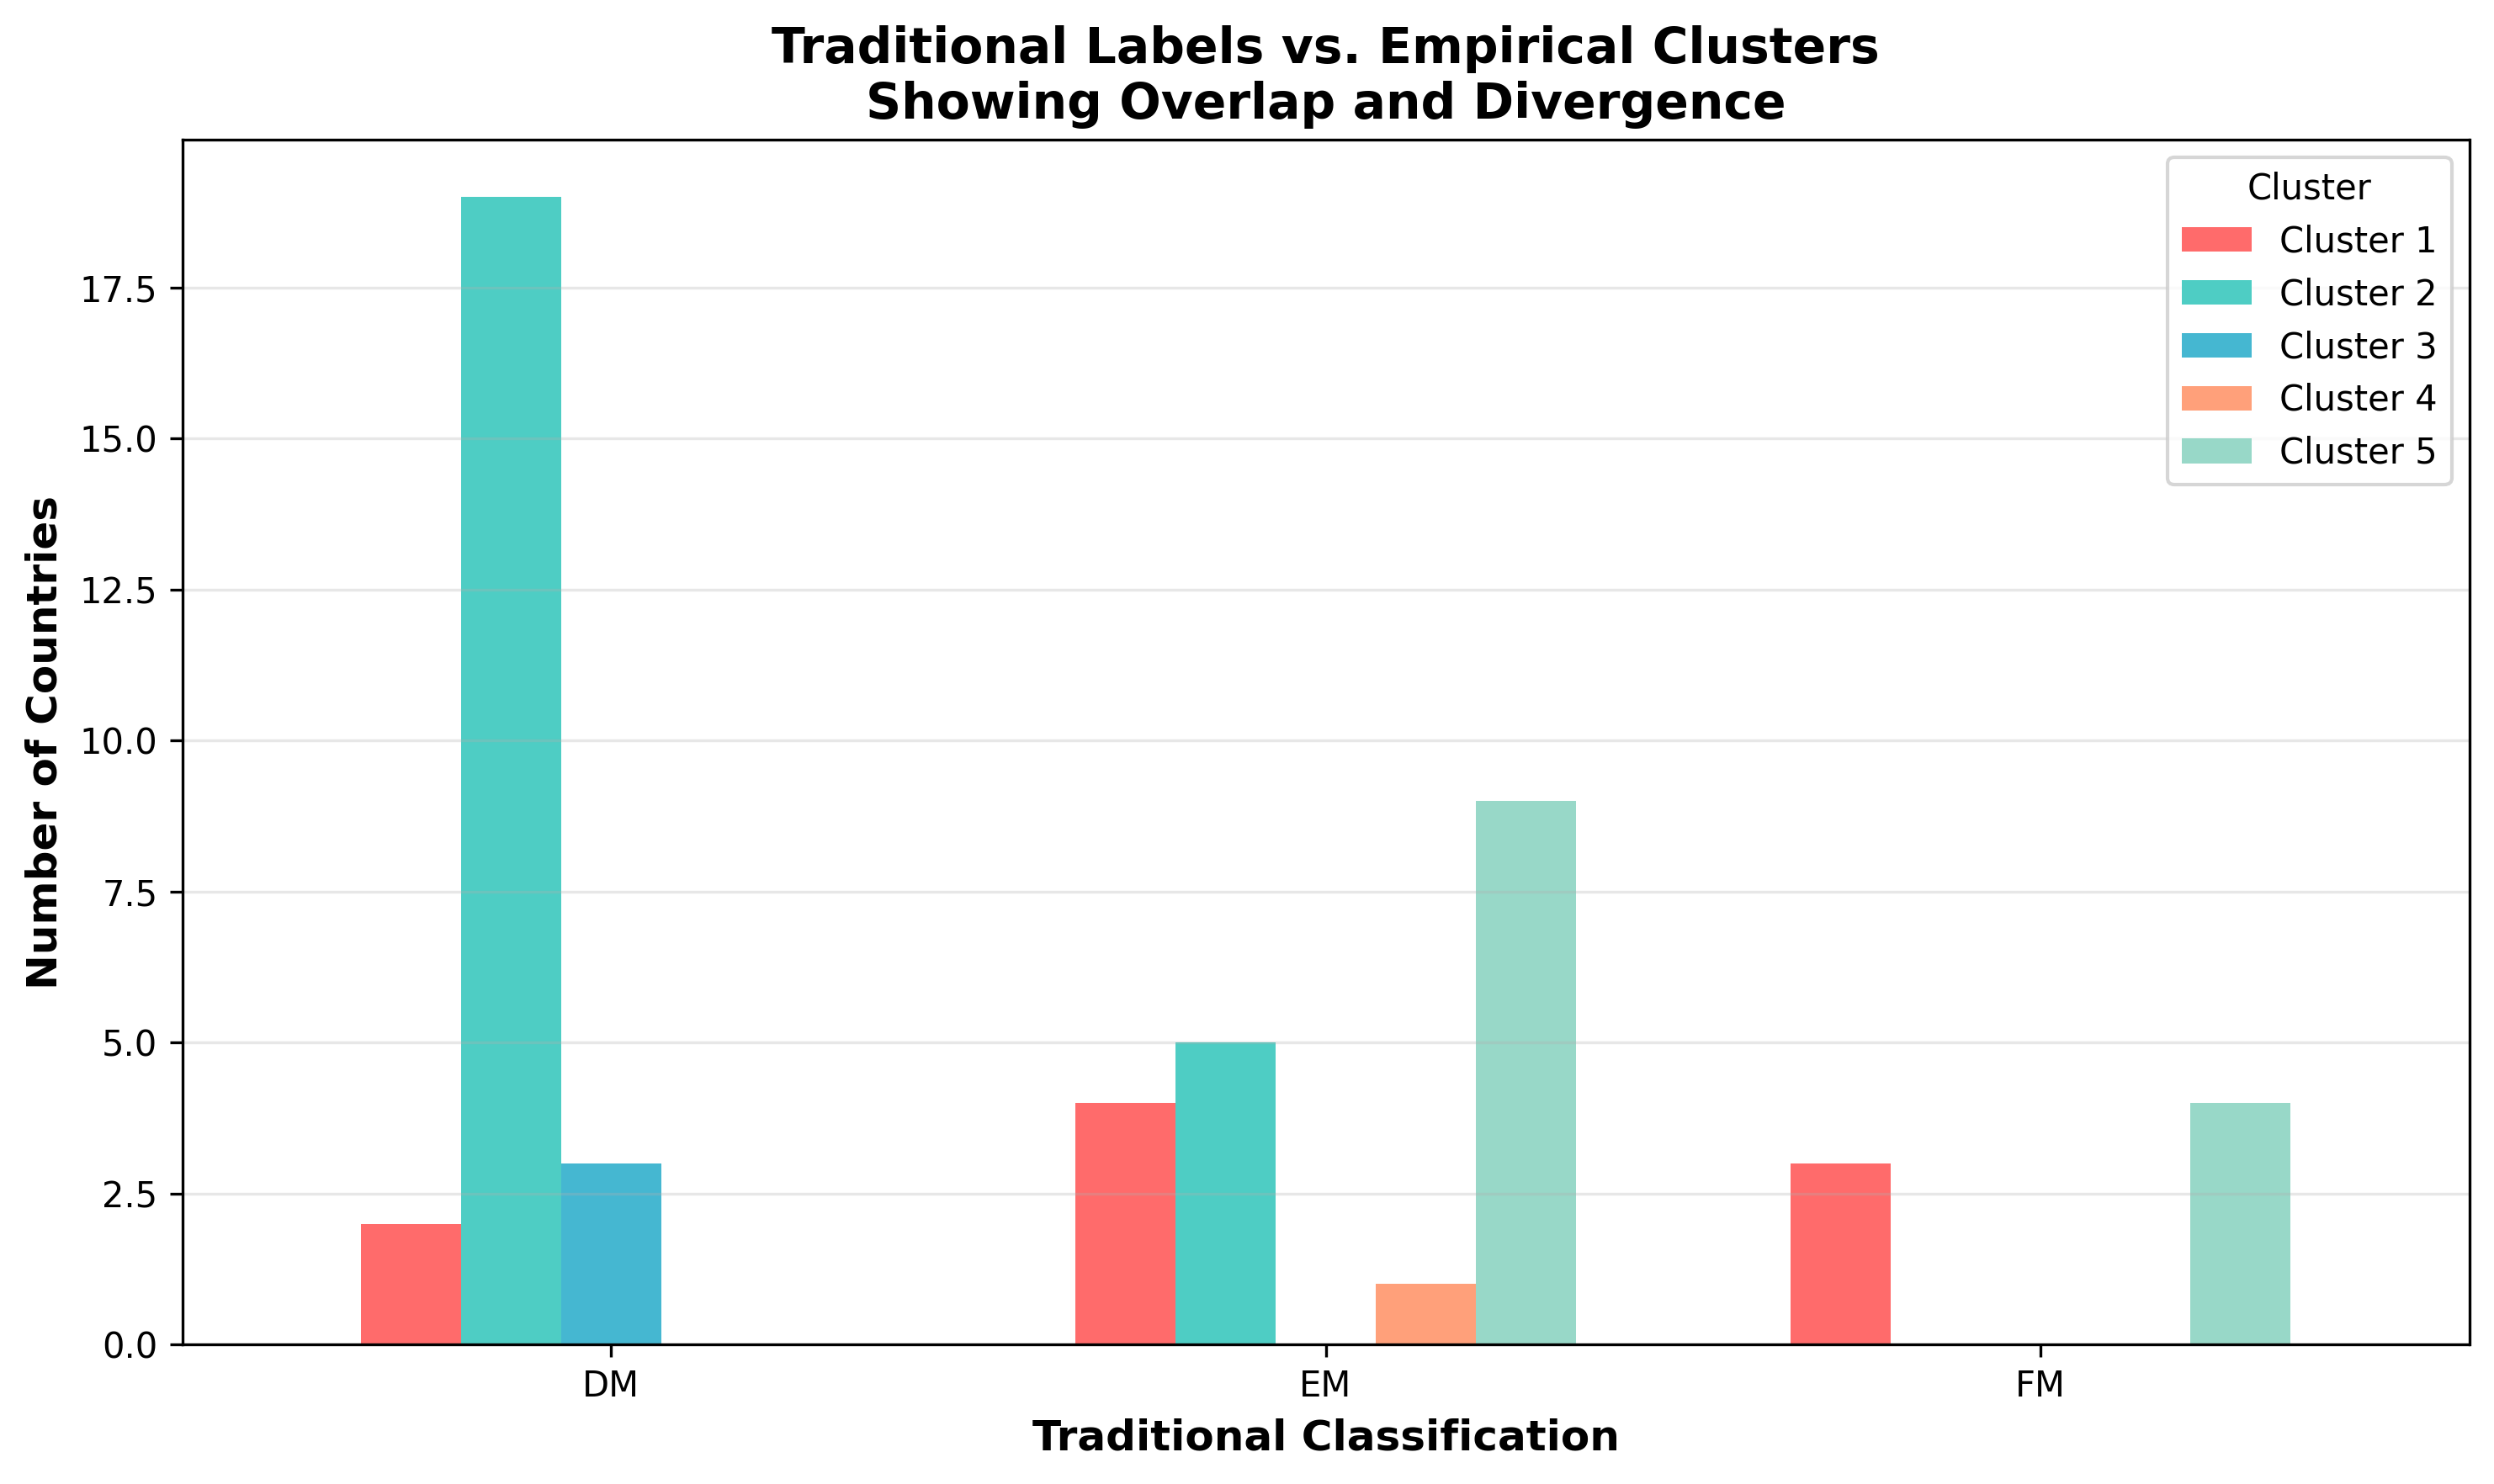
1.2 The Case for Empirical Clustering
Evidence-based clustering addresses these limitations by using actual economic data to identify countries with similar characteristics. Rather than relying on predetermined categories, we let the data reveal natural groupings based on objective economic indicators.
2. Methodology: Data-Driven Country Segmentation
2.1 Dataset and Features
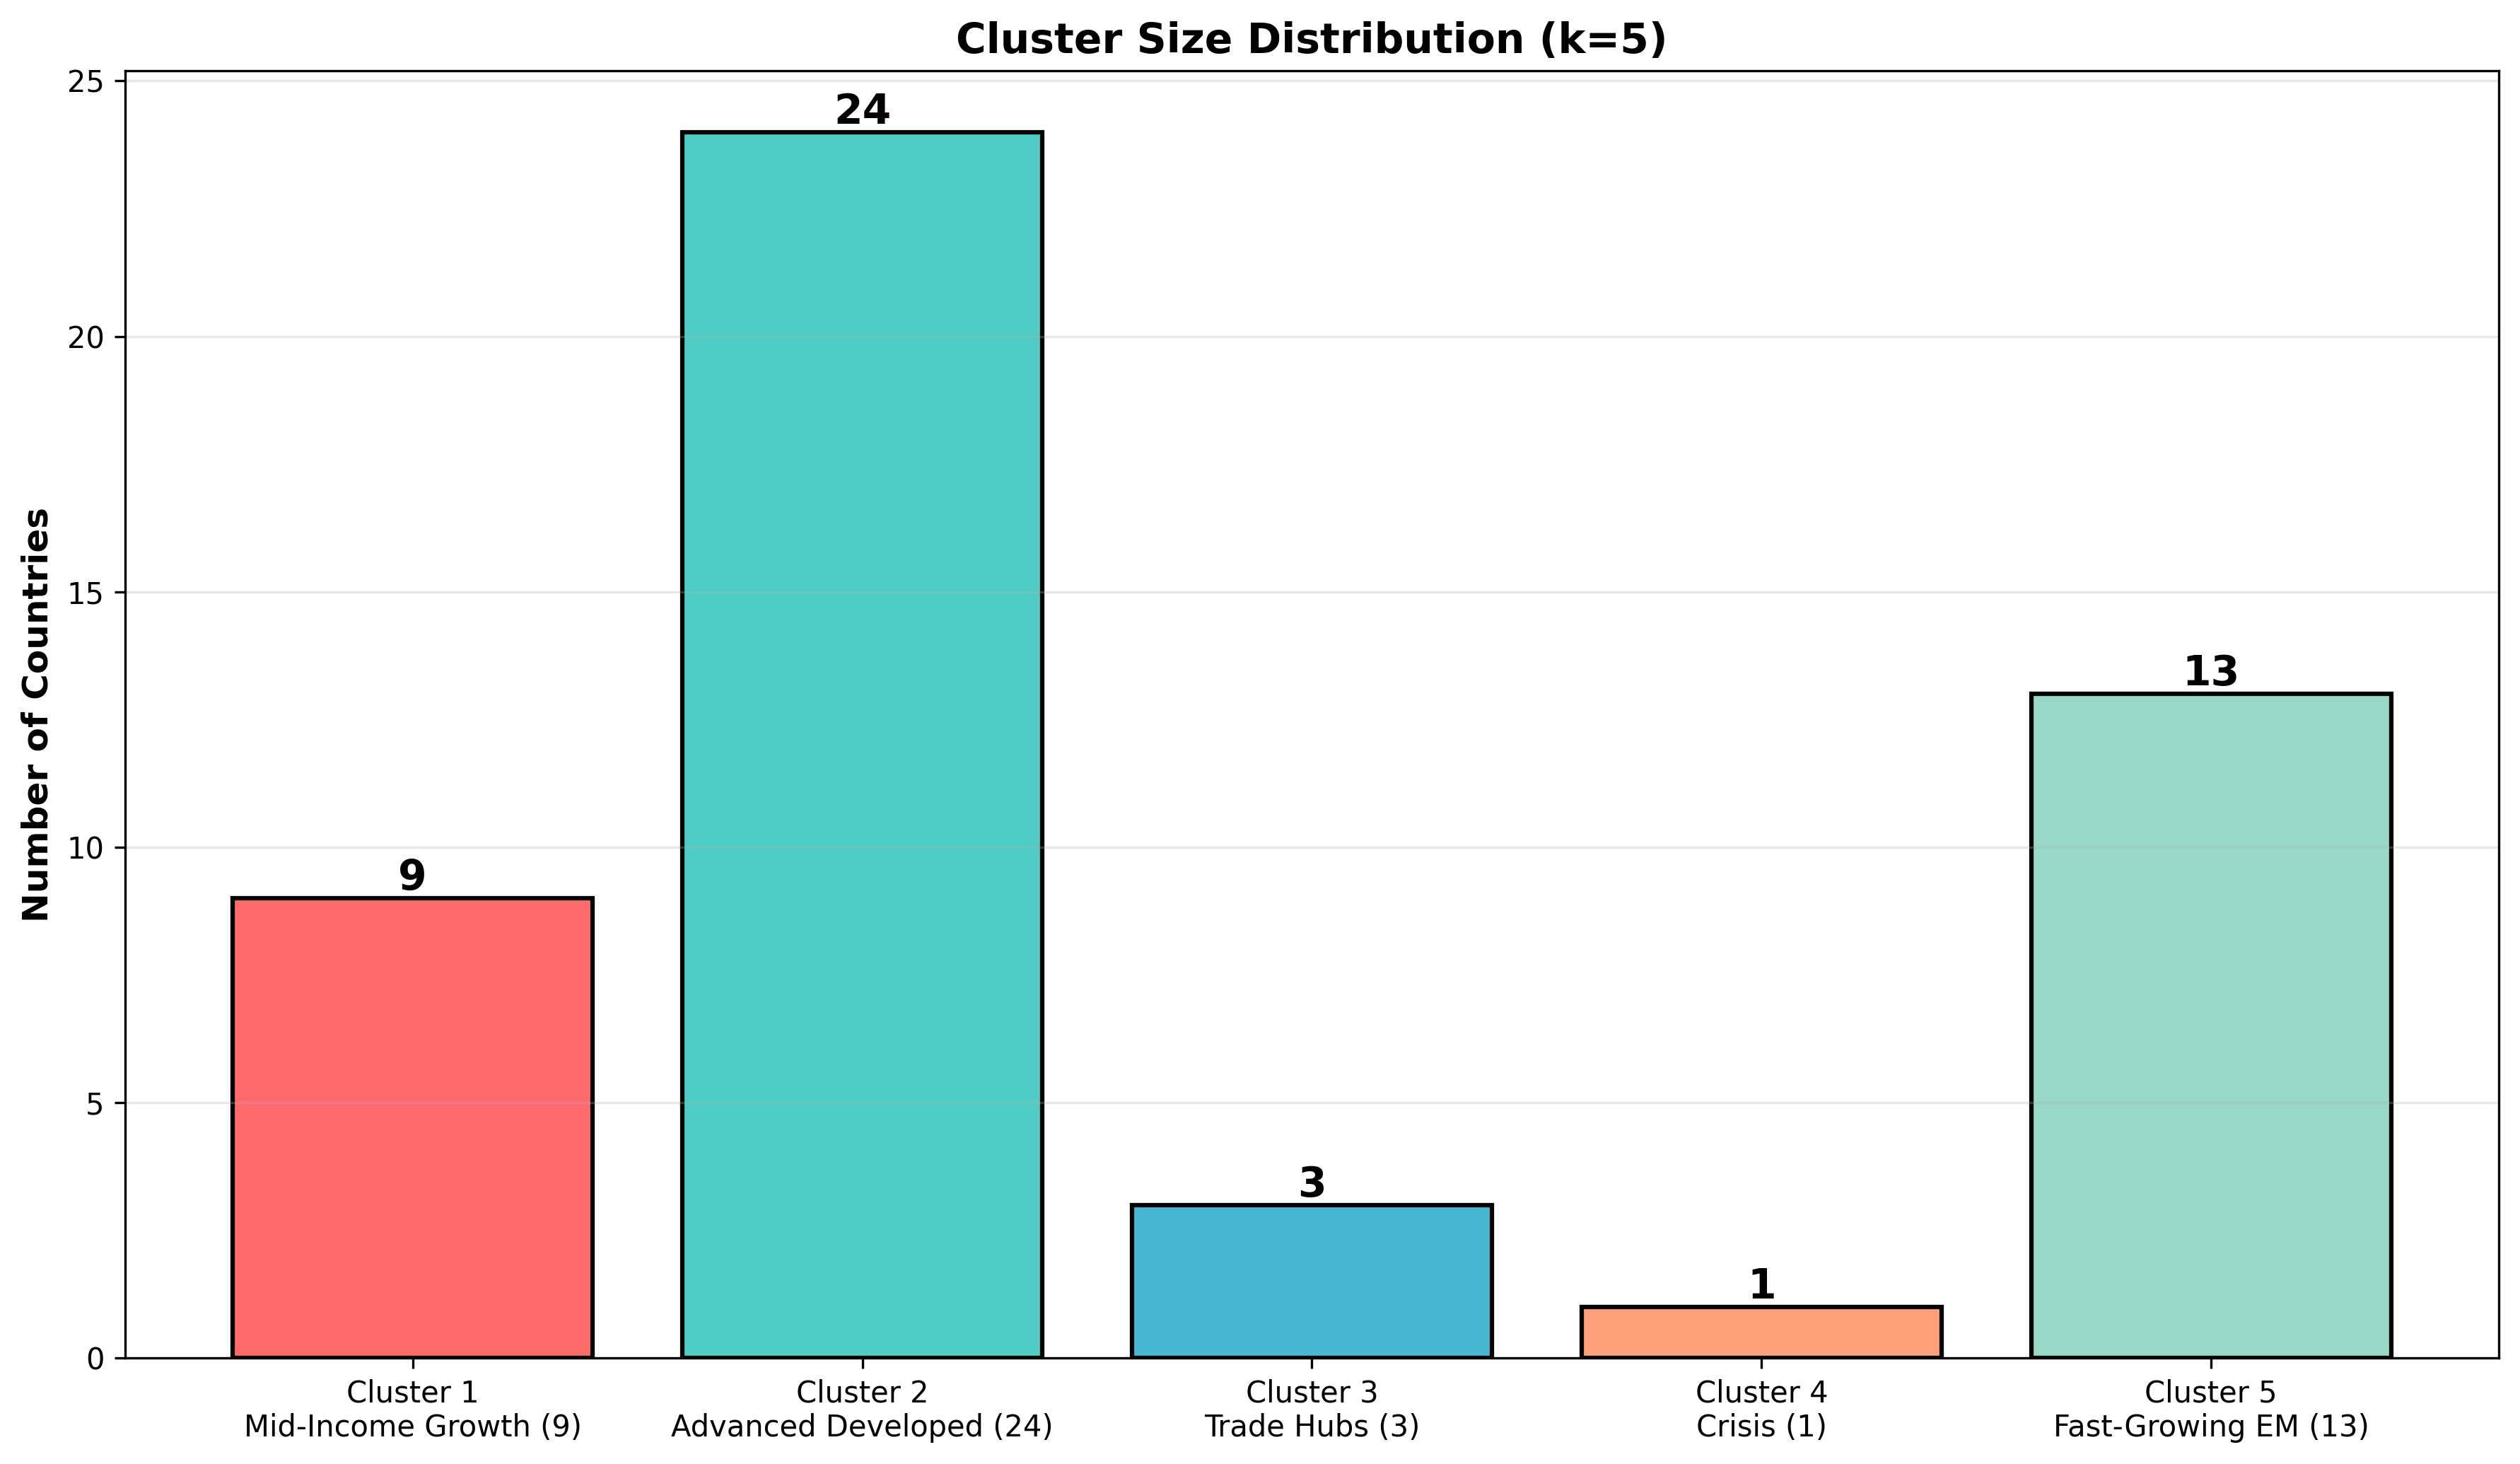
We analyzed the top 50 economies by GDP using 2024 data from the World Bank. After handling missing values, our final analysis incorporated six key economic indicators that capture fundamental economic characteristics:
- GDP per Capita - Economic development level and income
- GDP Growth Rate - Economic dynamism and momentum
- Unemployment Rate - Labor market health
- Inflation Rate (CPI) - Monetary stability and purchasing power
- Exports as % of GDP - Trade openness and export orientation
- Imports as % of GDP - Trade dependence and consumption patterns
Note: Five indicators (government revenue/expense, energy use, health expenditure, life expectancy) were excluded due to insufficient data coverage (>80% missing values across countries).
2.2 Clustering Technique: K-Means Algorithm
We employed the K-Means clustering algorithm, a proven unsupervised machine learning technique that partitions countries into k clusters by minimizing within-cluster variance. The algorithm iteratively assigns each country to the cluster with the nearest centroid until convergence.
To determine the optimal number of clusters, we evaluated solutions from k=2 to k=10 using two key metrics:
- Silhouette Score - Measures cluster cohesion and separation (range: -1 to 1, higher is better)
- Within-Cluster Sum of Squares (WCSS) - Measures cluster compactness (lower is better)
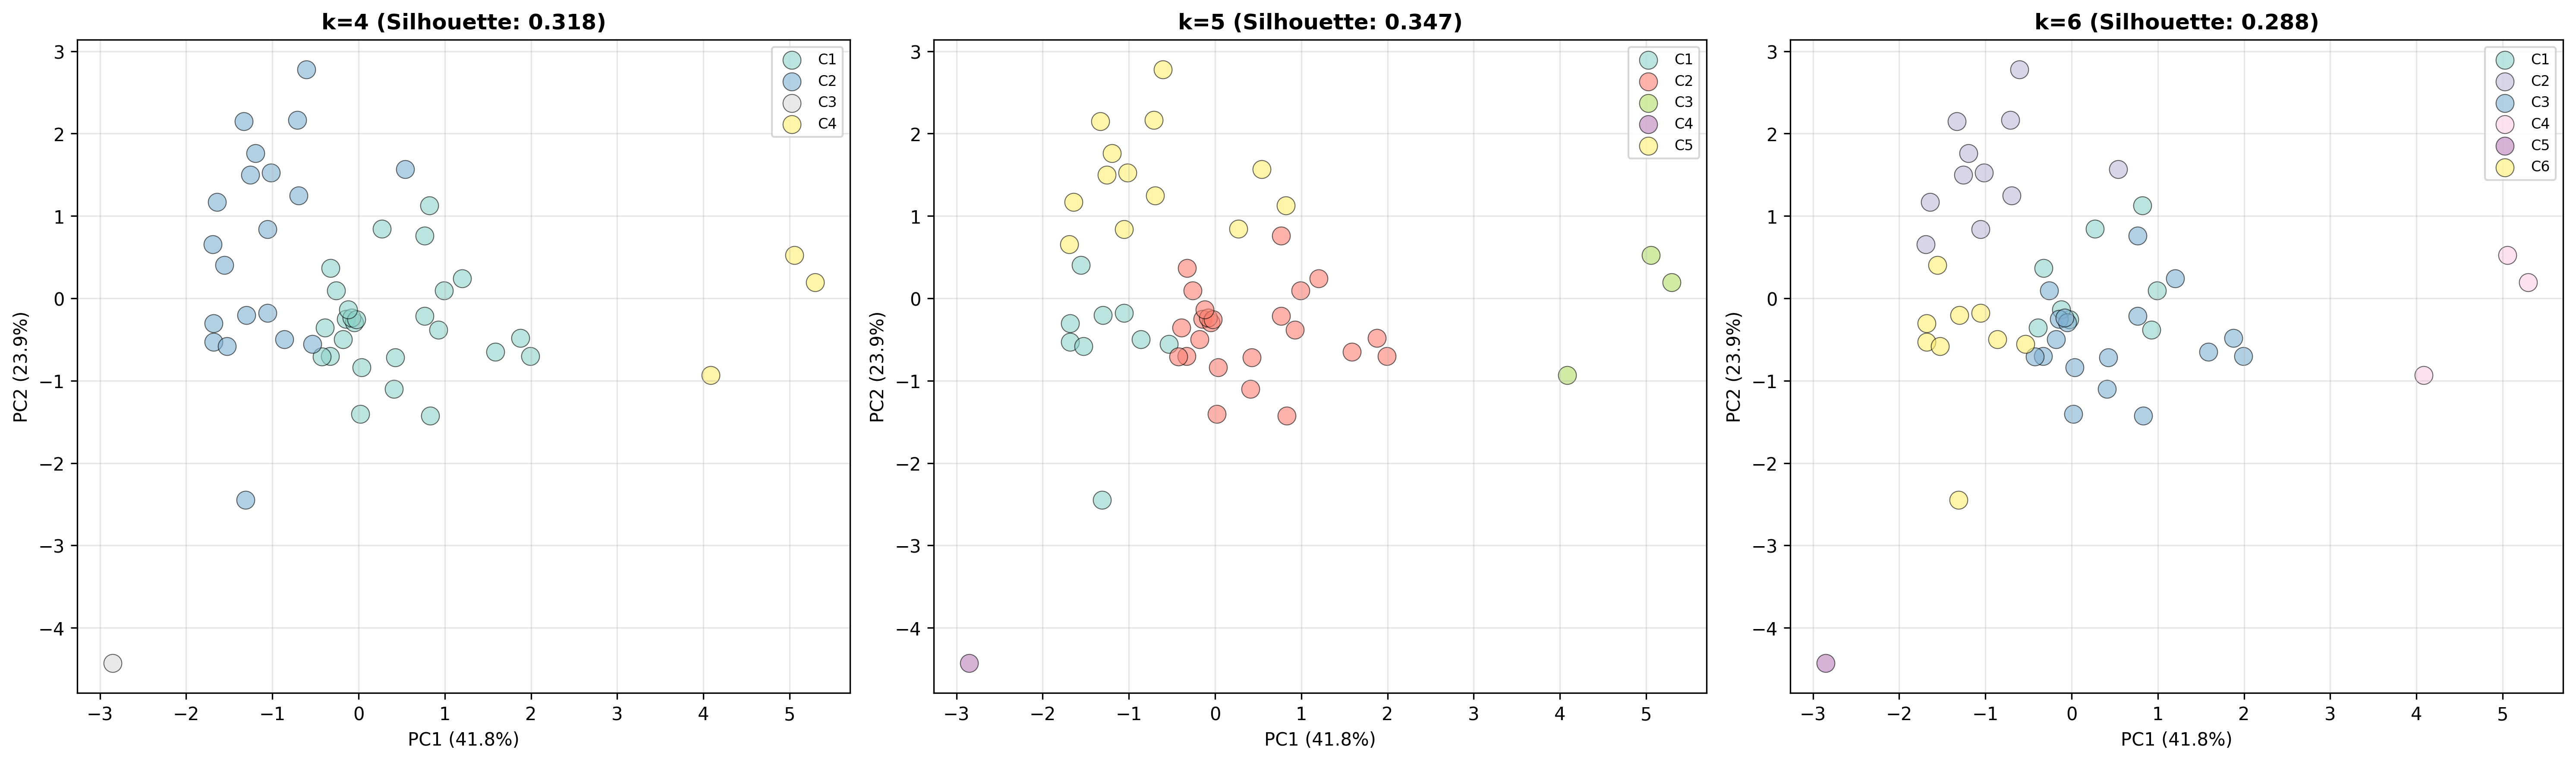
Our analysis identified k=5 clusters as optimal, achieving a Silhouette Score of 0.347—the highest among the k=4 to k=6 range we tested. While k=3 showed higher cohesion (0.537), it grouped 46 diverse economies together, limiting practical utility.
2.3 Principal Component Analysis for Visualization
To visualize high-dimensional economic data in two dimensions, we applied Principal Component Analysis (PCA). The first two principal components explain 65.7% of the variance in the data (PC1: 41.8%, PC2: 23.9%), providing a robust foundation for cluster visualization.
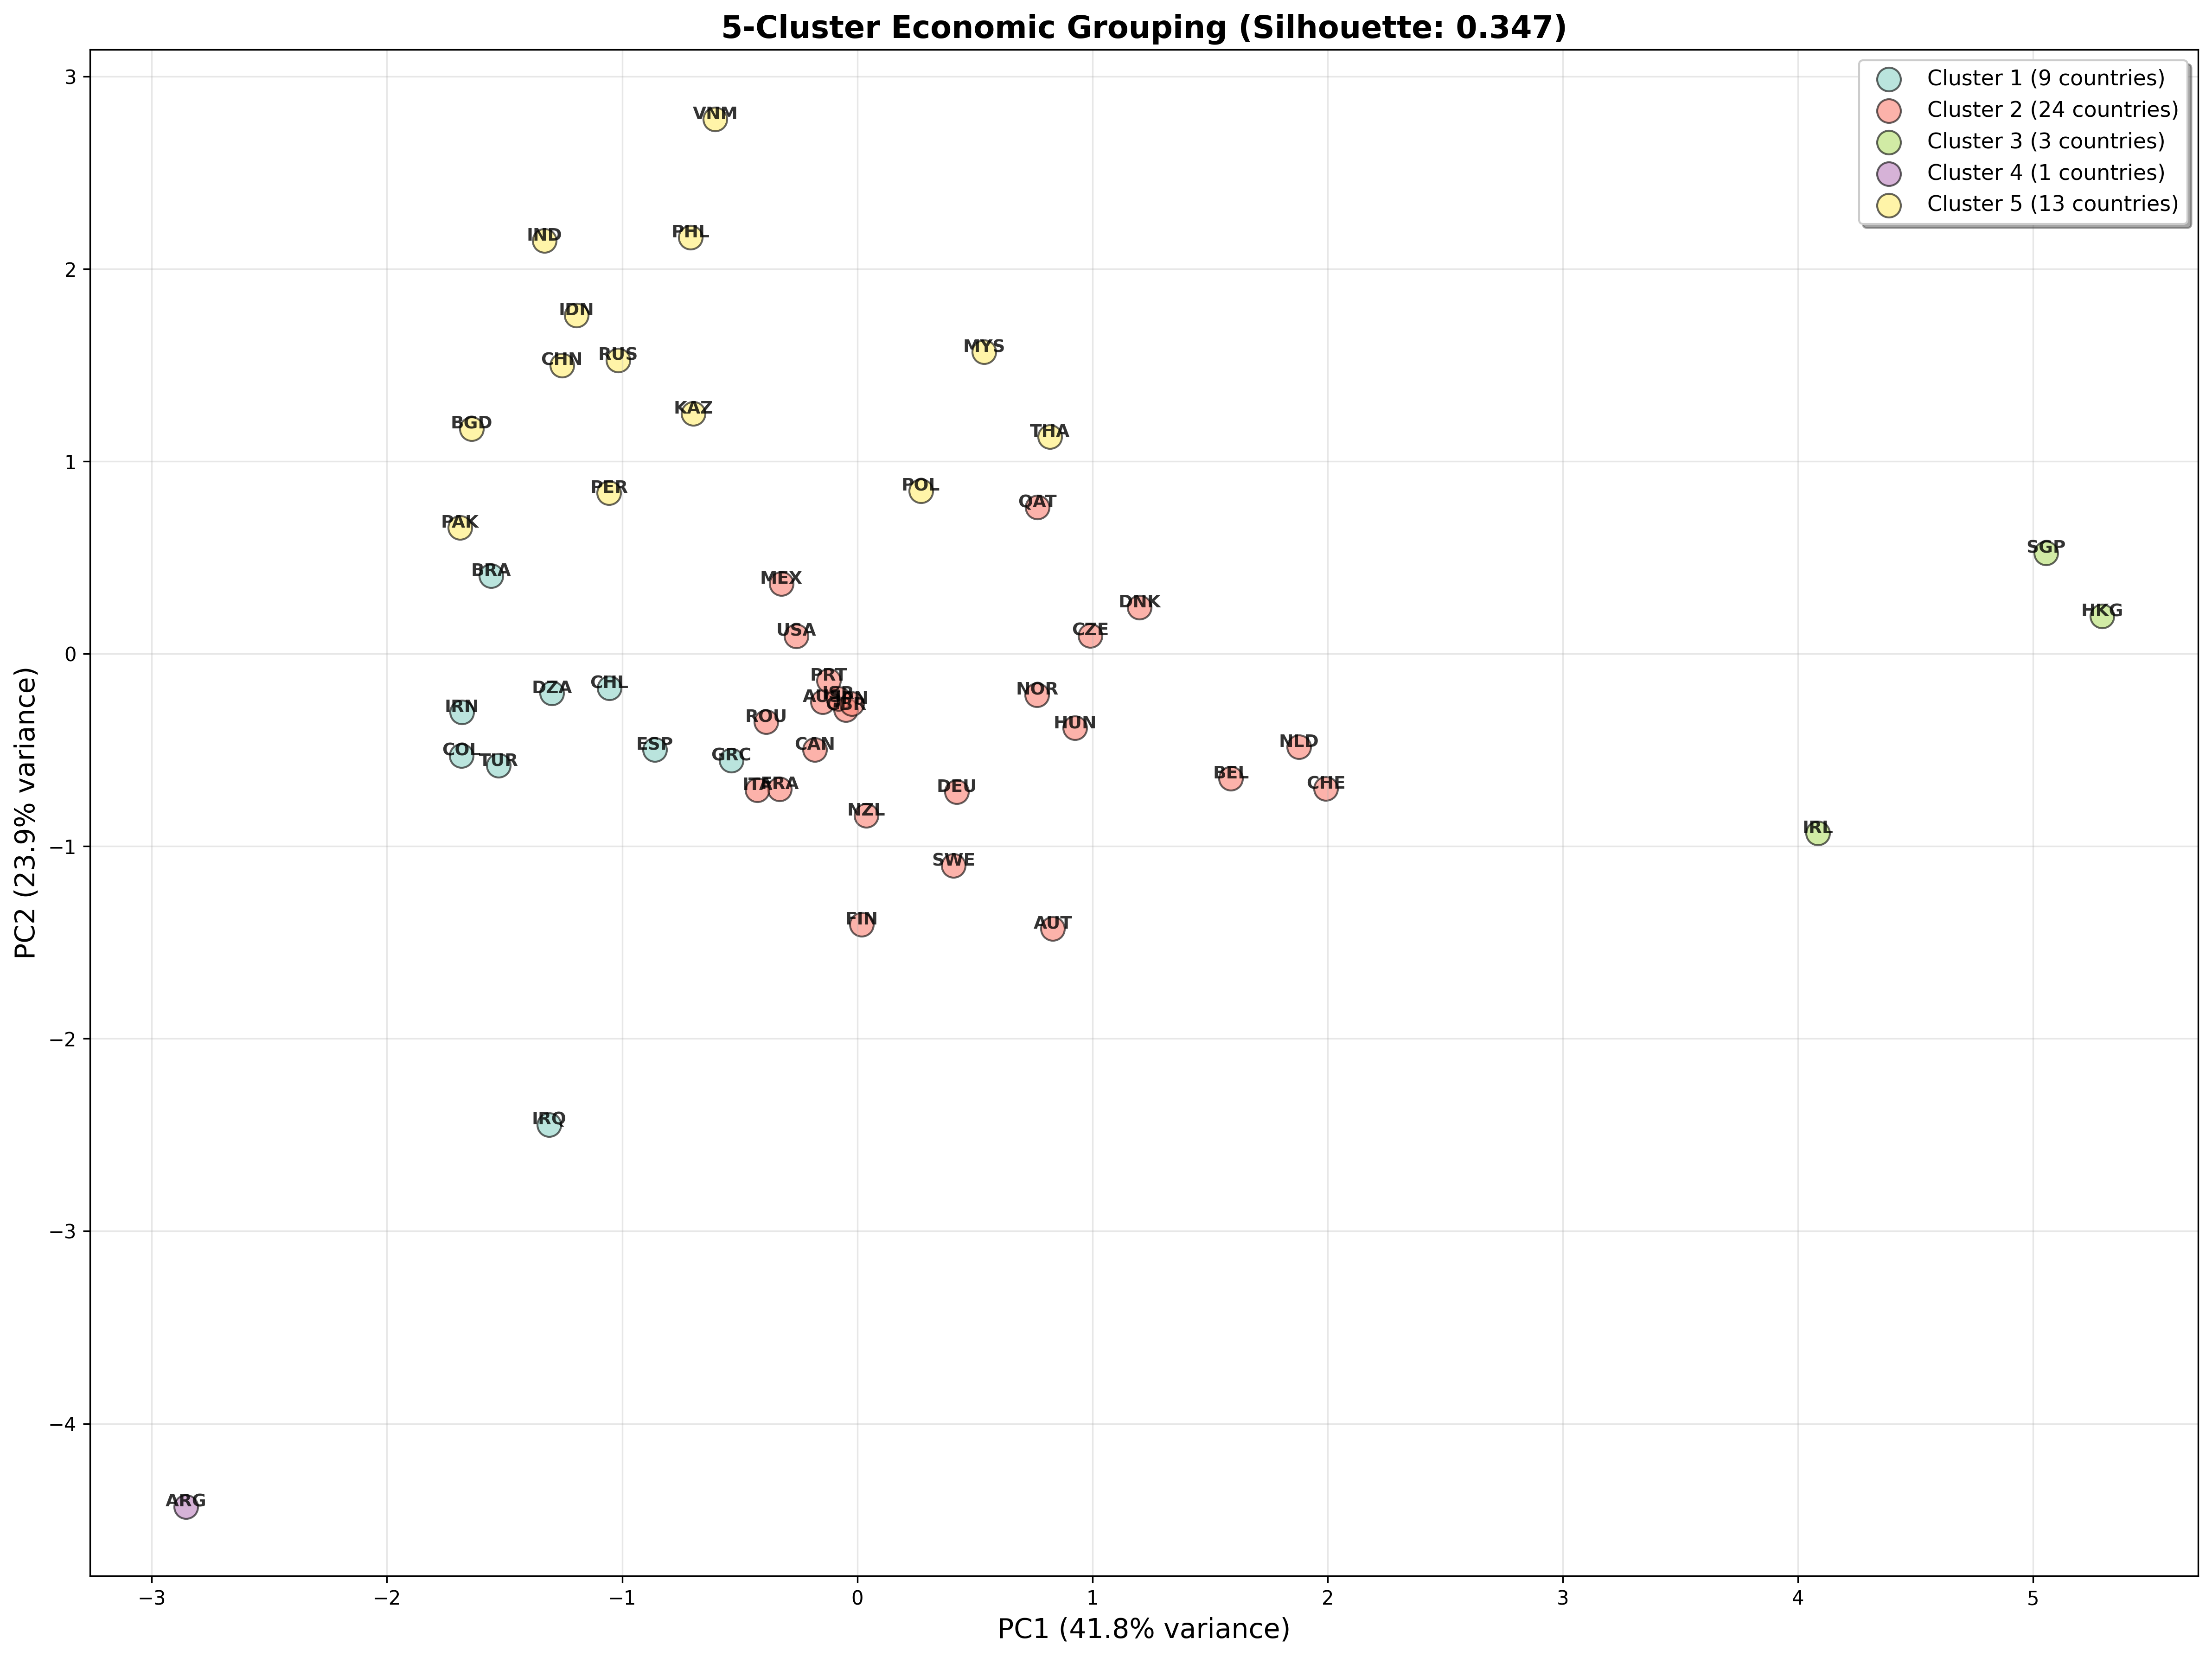
3. The Five Economic Clusters: Detailed Profiles
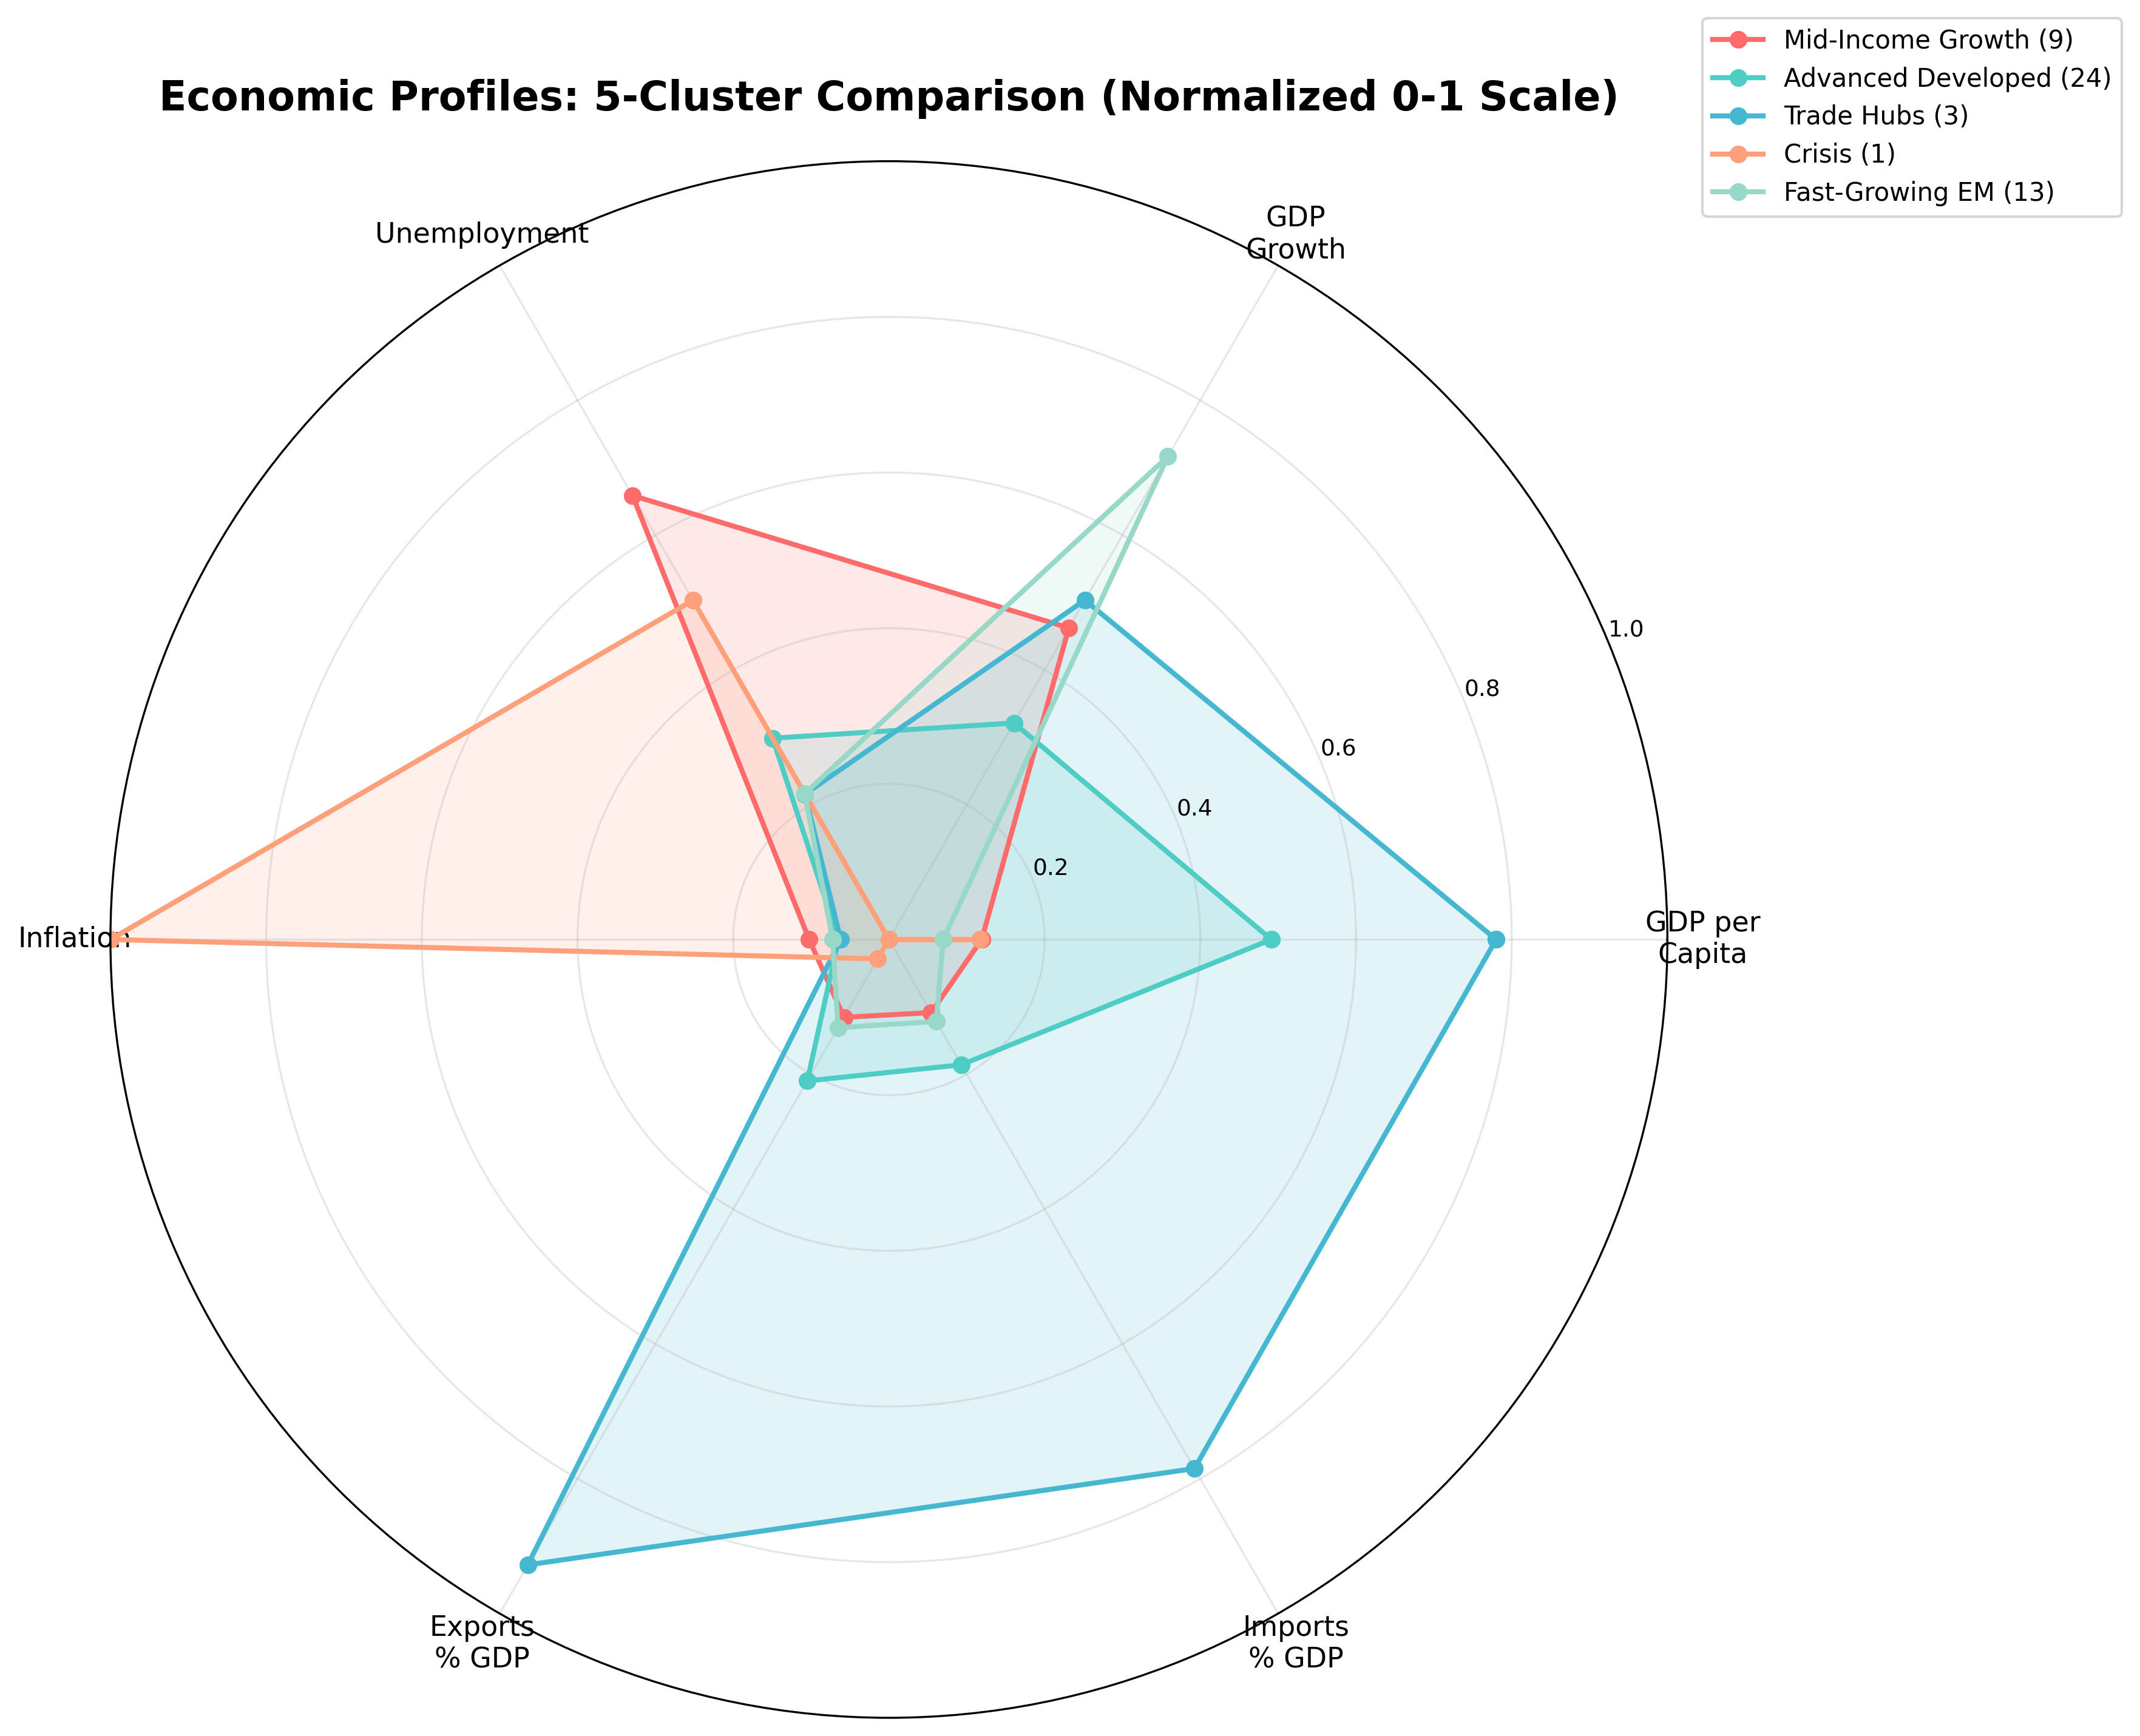
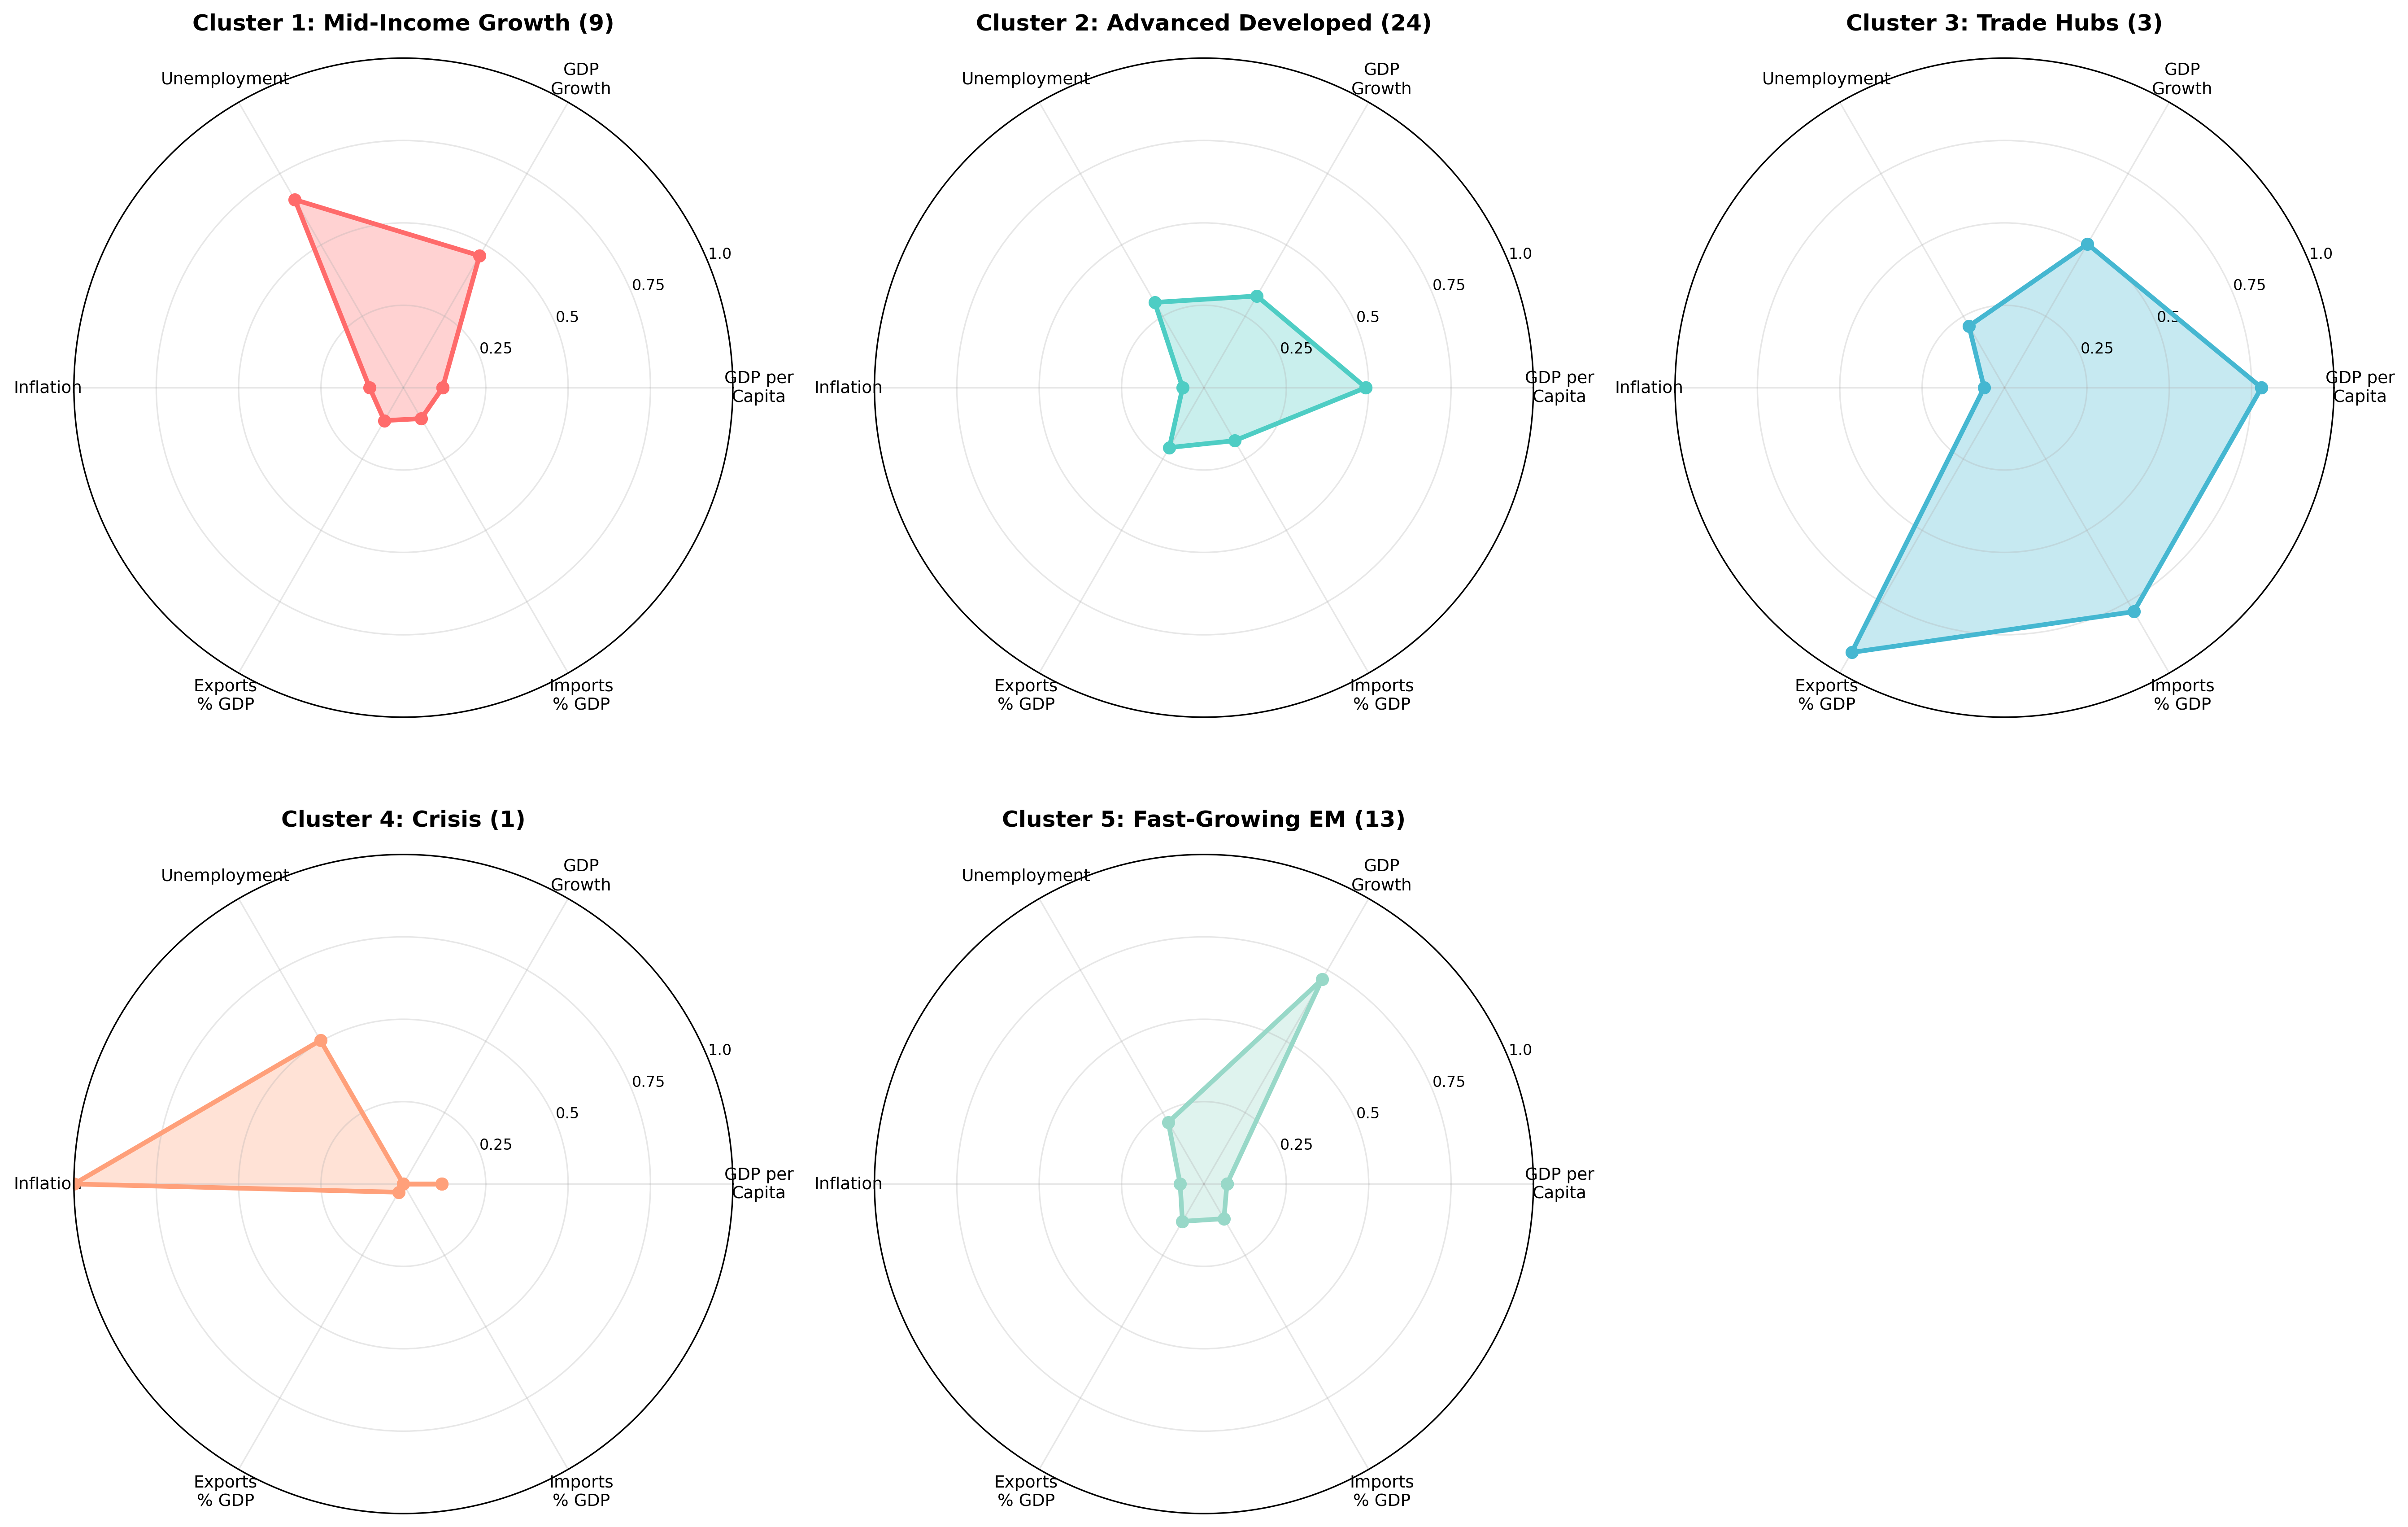
Our empirical analysis reveals five distinct economic groups, each with characteristic patterns across key indicators. The following spider chart provides a comparative view of all five clusters across our six economic dimensions.
3.1 Cluster 1: Mid-Income Growth with Inflationary Pressure (9 countries)
Countries: Brazil, Chile, Colombia, Algeria, Spain, Greece, Iran, Iraq, Turkey
Economic Characteristics: This cluster represents middle-income economies facing inflationary pressures significantly above global norms. The group includes a diverse mix of Latin American economies (Brazil, Chile, Colombia), Mediterranean countries (Spain, Greece), Middle Eastern nations (Iran, Iraq), and Turkey.
Common Challenges: These economies share struggles with price stability, often due to commodity dependence, fiscal imbalances, or geopolitical factors. Despite moderate growth rates, elevated inflation erodes purchasing power and complicates monetary policy.
Investment Implications: Investors must carefully manage inflation risk through commodity exposure, inflation-linked securities, or currency hedging strategies. These markets offer growth potential but require sophisticated risk management.
3.2 Cluster 2: Advanced Developed Economies (24 countries)
Countries: USA, Germany, Japan, UK, France, Canada, Australia, Italy, Netherlands, Sweden, Switzerland, Norway, Belgium, Austria, Denmark, Finland, Israel, Czech Republic, New Zealand, Portugal, Qatar, Romania, Hungary, Mexico
Economic Characteristics: This cluster comprises high-income, mature economies with strong institutions, stable macroeconomic environments, and well-developed financial systems. These countries demonstrate controlled inflation, moderate trade openness, and sustainable—if modest—growth rates characteristic of mature economies.
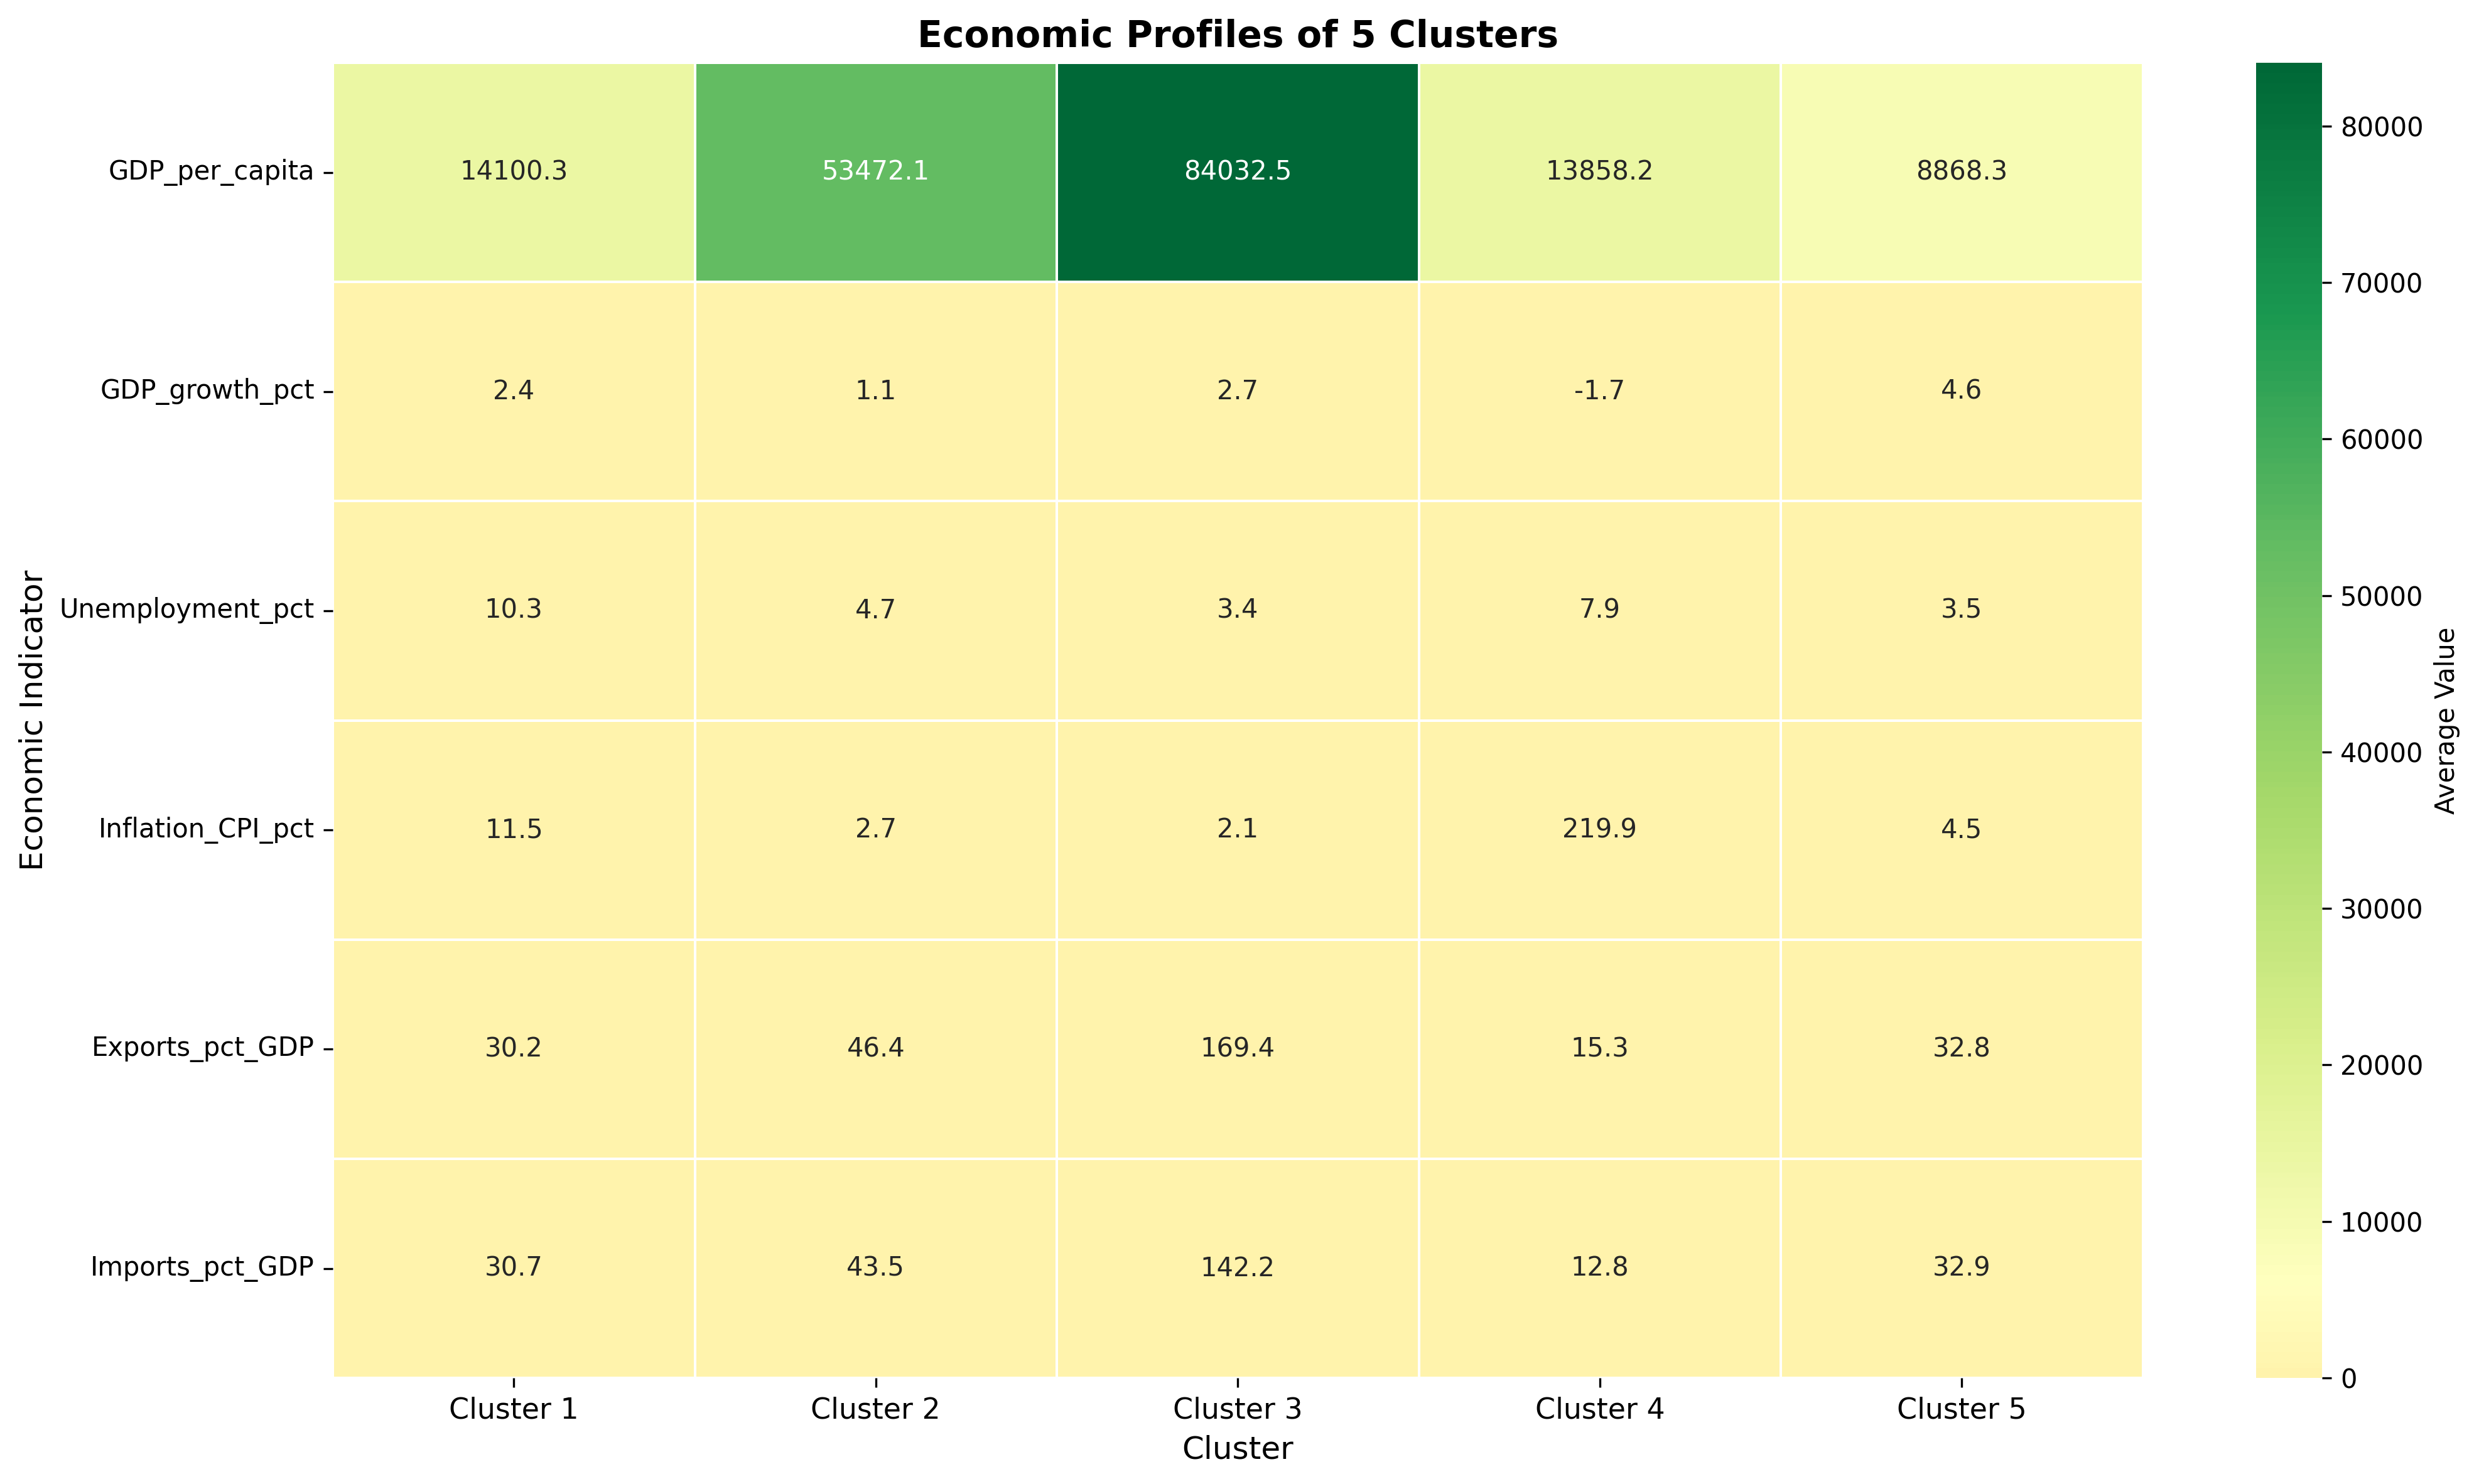
Stability and Quality: The defining feature of this cluster is economic predictability. Low inflation (2.7%) and stable growth reflect sound monetary policy, robust institutions, and diversified economic structures that buffer against shocks.
Investment Implications: These markets offer lower returns but reduced volatility, making them ideal for risk-averse investors, pension funds, and those seeking capital preservation. The presence of reserve currencies (USD, EUR, JPY, GBP) provides additional stability.
3.3 Cluster 3: Global Trade and Financial Hubs (3 countries)
Countries: Hong Kong, Ireland, Singapore
Economic Characteristics: This cluster represents small, ultra-open economies that serve as global trade and financial hubs. With trade volumes exceeding 300% of GDP—more than triple their domestic economic activity—these economies are fundamentally different from both developed and emerging markets.
Unique Economic Model: These countries have built prosperity on entrepôt trade, financial services, and multinational corporate operations. Their extraordinarily high GDP per capita ($84,032 vs. $53,472 for other DMs) reflects specialization in high-value services rather than traditional manufacturing or commodities.
Investment Implications: These hubs offer access to premium markets with sophisticated consumers, advanced infrastructure, and favorable business environments. Foreign direct investment flows heavily through these countries, leveraging their strategic positions and regulatory frameworks.
3.4 Cluster 4: Economic Crisis and Outlier (1 country)
Country: Argentina
Economic Characteristics: Argentina stands alone as a statistical outlier, characterized by hyperinflation (219.9%), economic contraction (-1.7% growth), and persistent macroeconomic instability. This cluster isolation reflects the severity and uniqueness of Argentina's ongoing economic crisis.
Crisis Dynamics: Argentina's chronic inability to control inflation, stabilize its currency, and maintain fiscal discipline has created an economic profile fundamentally different from all other major economies, warranting its own category.
Investment Implications: Argentina represents a high-risk, distressed opportunity requiring specialized crisis expertise. The country's isolation in our clustering validates the need for distinct strategies when engaging with economies experiencing severe macroeconomic dysfunction.
3.5 Cluster 5: Fast-Growing Emerging Markets (13 countries)
Countries: China, India, Indonesia, Bangladesh, Vietnam, Thailand, Kazakhstan, Malaysia, Pakistan, Peru, Philippines, Poland, Russia
Economic Characteristics: This cluster represents dynamic emerging markets with the highest growth rates (4.6%) among all clusters, driven by demographic dividends, industrialization, and global integration. These economies are characterized by lower income levels but rapid convergence toward advanced economy status.
Growth Drivers: Common factors include large working-age populations, expanding middle classes, increasing foreign direct investment, and integration into global value chains—particularly in manufacturing and services.
Investment Implications: These markets offer high growth potential with moderate risk. The combination of rapid GDP expansion (4× faster than Cluster 2) and controlled inflation (4.5%) creates attractive conditions for long-term capital appreciation. Infrastructure development, consumer growth, and technology adoption drive returns.
4. Superior Insights: Empirical vs. Traditional Classifications
4.1 The Problem of "One-Size-Fits-All" Developed Markets
Traditional classifications place 24 diverse economies—from the United States to Greece to Qatar—into a single "Developed Market" category. Our empirical analysis reveals this aggregation masks critical distinctions:
Traditional View: Hong Kong, Ireland, and Singapore are classified simply as "Developed Markets" alongside the USA, Germany, and Japan.
Empirical Reality: Our clustering identifies these three as a distinct economic category (Cluster 3) with fundamentally different characteristics:
- GDP per capita 57% higher than other DMs ($84,032 vs. $53,472)
- Trade openness 247% higher (311.6% vs. 89.8%)
- Economic models based on entrepôt trade and financial services rather than domestic consumption or manufacturing
- Policy challenges centered on maintaining competitiveness as service hubs, not typical DM concerns like aging populations or productivity growth
Strategic Implication: Investment strategies, market entry approaches, and competitive analysis for these trade hubs should differ fundamentally from approaches used for mainstream developed markets. A pharmaceutical company entering Ireland (biotech hub) faces entirely different dynamics than entering Germany (industrial powerhouse).
4.2 Distinguishing Growth Trajectories Within "Emerging Markets"
The traditional EM classification conflates economies with vastly different prospects. Our empirical approach separates:
- Cluster 5 (Fast-Growing EM): China, India, Indonesia, Vietnam—4.6% growth, $8,868 per capita, driven by industrialization and demographic dividends
- Cluster 1 (Mid-Income Growth): Brazil, Turkey, Colombia—2.4% growth, $14,100 per capita, facing 11.5% inflation and commodity dependence
- Cluster 4 (Crisis): Argentina—negative growth, hyperinflation, requiring turnaround strategies
These distinctions matter enormously for portfolio allocation, risk management, and market entry strategies. Cluster 5 economies offer 92% higher growth than Cluster 1 (4.6% vs. 2.4%), justifying different valuation multiples and investment horizons.
4.3 Capturing Economic Diversity Within Income Levels
Perhaps most significantly, our clustering cuts across traditional income-based boundaries to reveal behavioral similarities that matter more than GDP per capita alone:
- Spain and Greece (traditionally DM) cluster with Brazil and Colombia (traditionally EM) due to shared inflationary dynamics and growth patterns—revealing more about investment risk than their "developed" status suggests.
- Poland and Czech Republic (traditionally EM) cluster with USA, Germany, and Japan (DM) due to low inflation, stable growth, and integrated trade—more relevant for portfolio construction than their nominal classification.
- China (the world's second-largest economy) clusters with Vietnam and Bangladesh due to high growth rates—a more actionable insight than treating China as just another "emerging market."
4.4 Specific Example: Why Ireland Differs from Germany
To illustrate the power of empirical clustering, consider two countries both classified as "Developed Markets":
| Metric | Germany (Cluster 2) | Ireland (Cluster 3) | Difference |
|---|---|---|---|
| GDP per Capita | $56,000 | $106,000 | +89% |
| Trade Openness | 91% | 280% | +208% |
| Economic Model | Manufacturing, engineering, exports | Tech services, pharma, finance hub | Fundamentally different |
Strategic Insight: Despite both being labeled "Developed Markets," Germany and Ireland require completely different analytical frameworks. Germany's economy rests on advanced manufacturing and engineering excellence, while Ireland's success derives from attracting multinational tech and pharma operations through favorable tax policies. One-size-fits-all DM strategies fail in both markets.
4.5 Dynamic Adaptation to Economic Reality
Unlike static labels that change rarely, empirical clustering adapts to current conditions. When re-run with updated data, countries can move between clusters as their economic circumstances evolve:
- A country experiencing inflation surge (e.g., Turkey) naturally migrates toward Cluster 1
- An emerging market achieving stability and growth moderation (e.g., Poland) transitions toward Cluster 2
- A country entering crisis (e.g., Sri Lanka in 2022) would cluster with Argentina
This dynamic responsiveness ensures analysis remains relevant to current economic conditions rather than historical classifications.
5. Conclusion and Recommendations
5.1 Key Findings
Our evidence-based clustering analysis of the world's top 50 economies yields several crucial insights:
- Five distinct economic groups emerge from objective data analysis, providing more nuanced segmentation than the traditional DM/EM/FM trichotomy.
- Traditional "Developed Markets" are not homogeneous—our analysis identifies three sub-groups with fundamentally different characteristics (mainstream DMs, trade hubs, and mid-income with inflation).
- Trade hubs (Hong Kong, Ireland, Singapore) form a distinct category that traditional classifications fail to recognize, despite their unique economic models requiring specialized strategies.
- Fastest-growing emerging markets (China, India, Indonesia, Vietnam) share common characteristics that differentiate them from slower-growth, higher-inflation emerging economies—a distinction critical for growth investing.
- Economic outliers like Argentina require recognition as separate categories rather than being grouped with healthier emerging markets.
5.2 Practical Applications
Organizations can apply this empirical clustering approach across multiple domains:
For Investors:
- Construct portfolios with deliberate exposure across clusters rather than crude DM/EM splits
- Benchmark performance against appropriate peer sets (e.g., compare Ireland to Singapore, not to Germany)
- Identify mispriced assets by recognizing countries transitioning between clusters
For Corporations:
- Develop cluster-specific market entry strategies (trade hubs require different approaches than mainstream DMs)
- Tailor products and pricing to cluster characteristics (premium positioning for Cluster 3, value orientation for Cluster 5)
- Optimize supply chains by understanding cluster risk profiles
For Policymakers:
- Identify relevant peer countries for policy benchmarking (compare Spain to Brazil, not just to other European countries)
- Understand competitive position within appropriate reference group
- Learn from cluster-specific best practices
5.3 Recommended Analytical Framework
We recommend institutions adopt a hybrid approach that combines traditional classifications (for continuity and communication) with empirical clustering (for analysis and strategy):
- Continue using traditional labels for external communication and index construction (to maintain continuity)
- Employ empirical clusters for internal analysis, portfolio construction, and strategy development
- Update clustering annually with latest data to capture evolving economic conditions
- Supplement with cluster-specific research that recognizes within-group similarities and between-group differences
5.4 Future Enhancements
This analysis can be extended and refined through:
- Incorporating additional indicators: Adding data on government effectiveness, corruption, human capital, and financial development would enrich cluster definitions
- Temporal analysis: Tracking cluster transitions over time to identify countries improving or deteriorating
- Sub-cluster analysis: Further segmenting large clusters (e.g., Cluster 2's 24 countries) for even more granular insights
- Alternative methodologies: Testing DBSCAN, Gaussian Mixture Models, or ensemble methods to validate findings
5.5 Final Recommendation
Recommended Action
Replace static DM/EM/FM frameworks with dynamic, evidence-based clustering for analytical work while maintaining traditional labels for external reporting. This hybrid approach provides the best of both worlds: analytical rigor with practical continuity.
The five-cluster model presented here offers a more sophisticated understanding of the global economy than traditional binary or tertiary classifications. It recognizes that:
- Not all developed markets are similar (trade hubs vs. mainstream economies)
- Not all emerging markets face the same challenges (high-growth vs. mid-income trap)
- Economic outliers require specialized treatment (crisis economies)
For asset managers, policymakers, and corporate strategists seeking nuanced understanding of global markets, empirical clustering represents a significant advancement over traditional classification systems.
Frequently Asked Questions
What is evidence-based country grouping?
Evidence-based country grouping uses statistical methods like K-means clustering to segment economies based on measurable economic indicators rather than traditional labels like Developed, Emerging, or Frontier Markets. This approach reveals hidden similarities and differences between countries that static classifications often miss.
How does K-means clustering improve economic segmentation?
K-means clustering groups countries based on multiple economic variables simultaneously, creating data-driven clusters that reflect actual economic similarities. This method identifies patterns that traditional classifications overlook, such as countries with similar GDP growth, inflation, trade balances, and financial market development.
Why are traditional country classifications limited?
Traditional classifications (Developed, Emerging, Frontier Markets) are static labels that fail to capture the nuanced economic realities of individual countries. They can obscure critical distinctions, group dissimilar economies together, and lead to suboptimal investment and policy decisions.
How many economies were analyzed in this study?
The study analyzed the top 50 global economies using K-means clustering across multiple economic indicators to identify natural groupings and patterns that transcend traditional market classifications.
Published Nov 29, 2025 and not updated since. Personal views, not investment advice. See Disclosures.