Executive Summary
Thematic Research — Global Macro
China's economy has entered a structural deceleration phase, with real GDP growth slowing from double digits to the 4–5% range and a GDP deflator that turned negative in 2023–2024, marking the country's most sustained deflationary episode in decades. The confluence of a multi-year property downturn, excess industrial capacity, weak household consumption, and an export-driven growth model is generating profound spillovers across global commodity markets, manufacturing sectors, and financial systems.
Key Insights
- China's real GDP growth slowed to 4.96% in 2024 (WB WDI), down from 14.2% in 2007, with the GDP deflator at −0.76% — the first sustained deflation since the 1990s reform era
- Housing comprises ~70% of household wealth; the property downturn is now in its sixth year with new starts 75% below the 2021 peak, drawing explicit parallels to Japan's 1990s lost decade
- Household consumption is just 39.97% of GDP (2024) versus 67.91% in the US and 53.07% in Japan — the structural imbalance driving excess savings, overinvestment, and trade surpluses
- China's export prices have fallen ~20% since 2021 while its share of global exports rose from ~12% to ~18%, intensifying competitive pressure on Western and emerging-market manufacturers
- Commodity exporters face acute risk: when Chinese fixed-asset investment decelerated in 2012–2015, copper fell 40%, oil 60%, and iron ore 70%
- US imports from China fell sharply to $21.1B/month (Jan 2026) from $41.8B (Jan 2025), reflecting tariff-driven trade reconfiguration
- Sell-side consensus (Goldman Sachs, JPMorgan, BofA) projects 4.5–4.8% GDP growth for 2026 with deflation gradually easing but persistent through 2027
1. Introduction
China's position as the world's second-largest economy and the dominant engine of global manufacturing means that its domestic economic trajectory reverberates far beyond its borders. After decades of double-digit growth that lifted hundreds of millions out of poverty and reshaped global supply chains, China has entered a structurally slower growth phase — one accompanied by the most persistent deflationary pressures the country has experienced since the early reform era. This report synthesizes expert economic analysis, sell-side research, historical precedent, and primary data from the World Bank, FRED, and OECD to assess the causes, transmission channels, and global implications of China's sluggish growth and deflation for asset managers and investors.
The central thesis of this report is that China's current economic challenges are not a cyclical dip but a structural transition with far-reaching consequences. The property sector — which at its peak accounted for nearly a third of economic activity and roughly 70% of household wealth — is undergoing a multi-year correction with no quick resolution. Industrial overcapacity, fueled by years of credit-directed investment, is suppressing producer prices and exporting deflationary pressures to trading partners. Weak household consumption, held back by an insufficient social safety net and depressed confidence, prevents the domestic-demand rebalancing that economists widely identify as necessary.
For global investors, the implications are multifaceted: commodity exporters face demand headwinds; manufacturers in advanced and emerging economies confront intensifying price competition from subsidized Chinese exports; supply chains are being reconfigured under tariff and geopolitical pressure; and financial markets must price the risk that China's structural slowdown could, in an adverse scenario, become a global deflationary shock. This report does not offer policy recommendations. Rather, it distills the evidence to help asset managers and investors understand the landscape, identify the sectors most exposed, and frame expectations for the coming years.
2. Expert Perspectives
Leading academic and industry economists have extensively analyzed China's growth slowdown and deflation. Their perspectives, while differing in emphasis, converge on a structural diagnosis: China's growth model — built on credit-fueled investment, an oversized property sector, and suppressed household consumption — has reached its limits and is generating deflationary pressures both domestically and globally.
2.1 Michael Pettis — Carnegie Endowment / Peking University
Michael Pettis, professor of finance at Peking University's Guanghua School of Management and a nonresident senior fellow at the Carnegie Endowment for International Peace, is one of the most prominent critics of China's growth model. Pettis argues that China's deflationary pressures, huge trade surpluses, surging debt burden, and unviable investment in property, infrastructure, and manufacturing are all direct consequences of a political obsession with too-high GDP growth targets. He contends that maintaining growth targets above a sustainable level of perhaps 2–3% requires accelerating credit creation, which worsens the debt burden rather than resolving it.
Pettis disputes the notion that monetary expansion must be inflationary in China. Because credit is directed mainly toward the supply side of the economy — investment and production — rather than the demand side, rapid monetary and credit growth has been associated with deflation, not inflation. He draws an explicit parallel to Japan's pre-deflation experience and warns that without an institutional transformation redirecting credit toward household demand, the relationship between money and inflation will continue to diverge from advanced-economy norms.
On global implications, Pettis frames "China Shock 2.0" as the predictable next stage of the same adjustment process that began with WTO accession. As long as China's household share of income remains exceptionally low, the economy will continue generating excess savings that must be absorbed somewhere — and the rest of the world's willingness to absorb them is eroding. He argues that developing countries increasingly want to protect their own manufacturing, limiting China's ability to redirect its surplus.
"Chinese deflationary pressures are not an unexpected aberration but rather a consequence of its current growth model... The real challenge for Chinese policymakers is not how to increase growth targets, but how to accept lower growth — and a smaller share of global manufacturing — while restructuring the economy."
2.2 Eswar Prasad — Cornell University / Brookings Institution
Eswar Prasad, Tolani Senior Professor of Trade Policy at Cornell University, Senior Fellow at the Brookings Institution, and former head of the IMF's China Division, has warned since 2023 that China's economy is "sputtering" and that deflation in both producer and consumer prices raises real concerns about whether policy tools will have traction. Prasad emphasizes that private investment has collapsed, household consumption growth has weakened, and youth unemployment has risen sharply, threatening social stability.
Prasad argues that China needs a "broad and decisive policy package with both short-term and long-term measures" to pull the economy back from the brink. He has cautioned that relying on exports is "dangerous" for China, as it invites trade frictions and fails to address the structural weakness in domestic demand. He notes that China's policy space — both fiscal and monetary — has become more limited over time, complicating the response.
While Prasad acknowledges that China's high foreign-exchange reserves and domestic-currency debt reduce the risk of a classic emerging-market crisis, he stresses that the inefficient growth model, unbalanced reforms, and a "schizophrenic approach to the role of the market versus the state" could result in significant volatility even if a full collapse is not in the cards.
2.3 Kenneth Rogoff — Harvard University (with Yu Yang)
Kenneth Rogoff, professor of economics at Harvard University and former IMF Chief Economist, has co-authored a major comparative study (with Yu Yang) drawing explicit parallels between China's current real estate adjustment and Japan's 1990s lost decade. Their research, published as NBER Working Paper 35054, compares growth dynamics across nearly 300 Chinese cities and 47 Japanese prefectures, finding that regions with the largest overbuilding suffered the most severe downturns in both countries.
Rogoff and Yang emphasize the structural lesson that housing is highly durable: overinvestment during a boom cannot be unwound quickly, and excess supply hangs over the economy, discouraging new investment and weighing on activity long after volumes and prices peak. They note that real estate, together with its upstream and downstream linkages and infrastructure, accounts for nearly one-third of China's aggregate demand, and that housing comprises nearly 70% of household wealth — making the price correction a powerful negative wealth effect.
Their key finding is that China is still in the middle of a multi-year adjustment. The drag on growth runs through three "real" channels — investment overhang, consumption wealth effects, and sentiment — that operate independently of bank balance sheets. Japan's decades-long adjustment offers clues for how long China's property downturn can be expected to cut into growth.
"Japan's lost decade(s) offer a cautionary tale. China still has room to shape the outcome of its adjustment, but the window narrows as overcapacity, weak consumption, and negative sentiment reinforce one another."
2.4 Stephen Roach — Yale University / Former Morgan Stanley
Stephen Roach, senior fellow at the Yale Law School Paul Tsai China Center and formerly Morgan Stanley's Chief Asia Economist, argues that China's reliance on a production-based, export-driven model is unsustainable. He contends that weak Chinese domestic demand forces excess manufacturing supply onto global markets, creating risks that resemble past financial crises. The pillars of his argument are visible in the data: soaring exports, weak investment, weak retail sales, a housing collapse, and high precautionary household savings due to an insufficient safety net.
2.5 Li Daokui — Tsinghua University
Li Daokui, prominent economist at Tsinghua University and former member of the PBoC's Monetary Policy Committee, argues that the biggest problem facing China's macroeconomy is not K-shaped divergence but that "the economy as a whole is running cold — and this has already persisted for three years." Li emphasizes that the old growth engines — large-scale infrastructure investment and the real estate upswing — have faded, while new drivers of growth have not yet been created. With household consumption at roughly 35–38% of GDP, he argues the economy needs substantial structural rebalancing.
3. Market Intelligence
Sell-side institutions and international organizations provide a complementary, data-rich perspective on China's growth and deflation trajectory. Their forecasts, while differing in specifics, coalesce around a narrative of moderating growth (4.1–4.8% for 2026) and deflation that is gradually easing but persistent through 2026–2027.
3.1 Goldman Sachs Research
Goldman Sachs Research, led by Chief China Economist Hui Shan, projects China's real GDP to grow 4.8% in 2026, above the consensus of ~4.5%. Their most distinctive out-of-consensus view concerns China's current account surplus, which they expect to rise to 4.2% of GDP in 2026 (from 3.6% in 2025), versus Bloomberg consensus expecting a decline to 2.5%. This surplus resilience stems from rapid export expansion to emerging markets, China's dominance in critical minerals, and growth in high-tech exports.
Goldman forecasts producer price inflation (PPI) at −0.7% for 2026, modestly higher than the consensus of −1.0%, reflecting the government's "anti-involution" policies designed to curb price competition among manufacturers. They expect the property sector to remain a drag, contributing roughly 2 percentage points to real GDP drag in 2024–2025, easing by about 0.5 percentage points per year going forward. New housing starts are 75% below peak, and property investment is 50% lower.
3.2 JPMorgan Asset Management
JPMorgan notes that China lowered its 2026 growth target to 4.5–5.0%, placing greater emphasis on "quality growth." They expect growth to moderate with deflation continuing to fade, and see the PBoC's rate upside capped by mild easing. They project 10–20 basis points of policy rate cuts and a possible 50 bp RRR cut in 2026, but do not expect aggressive easing given limited remaining room.
On the latest data, JPMorgan reports that China's real GDP grew 4.3% year-over-year in 2Q26, down from 5.0% in 1Q, with domestic demand remaining the key constraint. Exports were the standout contributor, up 27% year-over-year in June 2026, driving a near-record trade surplus of $125.6 billion. They note that while the case for additional policy support has strengthened, the resilience of exports and high-tech manufacturing gives policymakers room to avoid large-scale stimulus.
3.3 Bank of America Global Research
Bank of America, led by Greater China Chief Economist Helen Qiao, forecasts 4.7% GDP growth in 2026 and 4.5% in 2027, above consensus. BofA identified five structural themes supporting the global economy, including China's industrial overcapacity, record fiscal deficits, and excess liquidity. They raised their 2026 CPI inflation forecast to 0.7% (from 0.1%) and PPI to 0.3% (from −0.7%), citing stronger domestic demand, higher energy prices, and AI-linked gains in metals and electronics.
However, BofA highlights that domestic demand and the pace of economic rebalancing have been disappointing, and they now forecast export growth of 15% in 2026, driven by AI-linked investment and robust demand for renewable energy equipment and EVs.
3.4 Morgan Stanley
Morgan Stanley frames China's situation as a tension between "Old China" — rooted in real estate and low-cost manufacturing, facing excess capacity and deflationary pressures — and "New China," undergoing technological and industrial transformation. China now accounts for 28% of global manufacturing output, up from 5% in 2000, with a goods trade surplus exceeding a trillion dollars. As the US share of China's exports has declined, shipments to emerging markets have risen to around 45% from 34% in 2016.
3.5 Fitch Ratings
Fitch Ratings is among the more cautious forecasters, limiting 2026 growth to 4.1% due to domestic demand weakness. They note that retail sales growth is weak, fixed-asset investment growth turned negative in annual terms in 2Q26, and registered unemployment rose 15.6% in 2025. Unit labor costs fell at their fastest rate since 1998, pointing to an economy operating below capacity that will weigh on domestic prices.
3.6 OECD and IMF
The OECD Economic Outlook (Volume 2026 Issue 1) projects China's growth to slow to 4.5% in 2026 and 4.3% in 2027, with inflation remaining low but between 1–2%. The OECD expects real estate investment to continue contracting and prices to fall, while infrastructure investment picks up driven by mega projects. The IMF's 2025 Article IV Consultation reports that the GDP deflator was −1% in 2025 and is expected to remain negative at −0.7% in 2026, aggravating adverse debt dynamics.
3.7 Rhodium Group and Capital Economics
Rhodium Group offers a more bearish independent assessment, estimating that China's actual growth was likely 1.5–2.0% in 2023 and 2.4–2.8% in 2024 — well below official figures. They argue that manufacturing investment has fallen from 9.2% growth in 2024 to 1.9% through November 2025, and that China will be even more dependent on its trade surplus for growth in 2026.
Capital Economics frames China's growth model as "a lose-lose" — deflation at home, disruption abroad. They note that China's export prices have fallen ~20% since 2021 while export prices elsewhere remained broadly stable, and that China's share of global exports has risen from ~12% in 2020 to ~18% today. They expect China's trade surplus to rise rather than fall, further squeezing Western firms, and predict China's share of global GDP will continue to decline.
| Institution | 2026 GDP Forecast | 2027 GDP Forecast | Deflation Outlook |
|---|---|---|---|
| Goldman Sachs | 4.8% | 4.7% | PPI −0.7%; gradually easing |
| JPMorgan AM | 4.5% | — | Deflation to remain; gradual normalization |
| Bank of America | 4.7% | 4.5% | CPI 0.7%, PPI 0.3% (revised up) |
| Fitch Ratings | 4.1% | — | Weak domestic demand weighs on prices |
| OECD | 4.5% | 4.3% | Inflation 1–2%; deflation easing |
| IMF (Article IV) | ~4.5% | — | GDP deflator −0.7% in 2026 |
| ADB | 4.6% | 4.5% | CPI 0.6% in 2026, 1.0% in 2027 |
| Consensus Range | 4.1–4.8% | 4.3–4.7% | Deflation fading but persistent |
4. Historical Context
Understanding China's current deflationary episode requires historical perspective. Several periods offer instructive parallels and warnings, both from within China's own history and from the experiences of other economies that underwent similar structural transitions.
4.1 China's 1998–2002 Deflationary Episode
China experienced a notable deflationary period from 1998 to 2002, following the Asian Financial Crisis and during a period of domestic structural reform. The consumer price index fell for extended periods, and the GDP deflator dipped into negative territory. The episode was driven by excess capacity from the preceding investment boom, weak domestic demand, and the aftermath of state-owned enterprise reforms that displaced millions of workers. The government responded with large-scale fiscal stimulus, infrastructure investment, and housing market liberalization — measures that eventually reignited growth but also set the stage for the property-centric growth model that is now unwinding.
4.2 The 2008–2009 Global Financial Crisis Response
China's response to the 2008–2009 global financial crisis is central to understanding today's structural imbalances. The ¥4 trillion ($586 billion) stimulus package, announced in November 2008, was disproportionately directed toward infrastructure and property investment. While it succeeded in maintaining growth — China's GDP grew 9.2% in 2009 even as the global economy contracted — it dramatically expanded the role of credit-fueled investment in the economy. Gross capital formation as a share of GDP rose to over 46% by 2010–2011, levels unprecedented in any major economy. This investment-heavy response planted the seeds of today's excess capacity and debt overhang.
4.3 Japan's Lost Decade (1990s) — The Defining Parallel
The most frequently cited historical parallel is Japan's post-bubble stagnation. Rogoff and Yang's research draws "striking parallels" between China's current real estate adjustment and Japan's experience in the 1990s, "despite profound institutional differences." The parallels include:
- Demographics: China's population is aging even faster than Japan's did, with a shrinking labor force and rising dependency ratios
- Overdevelopment: Both countries experienced massive overbuilding in real estate, with excess supply that takes years to absorb
- Wealth effects: Housing wealth dominates household balance sheets in both cases — roughly 70% in China — so price declines generate powerful negative wealth effects
- Investment overhang: The drag on growth operates through investment overhang, consumption wealth effects, and sentiment, independent of banking-sector dynamics
The key differences are also important: China is poorer, less financially liberalized, and operates under a very different political system. China's state-dominated financial system has so far kept the downturn from becoming a banking crisis. Land is state-owned in China (versus private in Japan), and real estate debt is structured differently (local government financing vehicles rather than corporate borrowing). However, the comparison holds because the core dynamics of durable housing overhang and macroeconomic spillovers are strikingly similar.
The cautionary lesson from Japan is that the adjustment can last far longer than a decade. Japan's real estate returns turned negative in the early 1990s and stayed at persistently low levels through the early 2000s. The question for China is whether it can manage its retreat from real estate more effectively — but the window narrows as overcapacity, weak consumption, and negative sentiment reinforce one another.
4.4 The 2012–2015 Investment Deceleration and Commodity Shock
A critical precedent for understanding China's global spillover potential is the 2012–2015 period, when Chinese fixed-asset investment decelerated. The commodity price impacts were dramatic: copper prices fell by over 40%, oil by over 60%, and iron ore by over 70%. This sharp drop caused GDP growth in resource-intensive sub-Saharan African countries to fall from 5.3% in 2013 to 1.3% in 2016 — the lowest in more than two decades.
This episode illustrates the sensitivity of global commodity markets to Chinese demand. Countries that send 25–40% of their exports to China — Australia, Brazil, Chile — and those sending 45–90% — Angola, DRC, Mongolia, Republic of the Congo — are economically dependent on the continuation of a "standing Chinese bid." The current structural slowdown, if it deepens, could produce a considerably worse commodity shock than 2012–2015.
4.5 The Property Sector Timeline (2020–Present)
The current property downturn began with the introduction of the "three red lines" policy in August 2020, which imposed borrowing limits on property developers. This triggered the collapse of China Evergrande Group in 2021 — once the world's most valuable real estate company. The downturn has now persisted for over five years, with new housing starts 75% below the 2021 peak and property investment 50% lower. Home prices have been declining for over 29 consecutive months as of mid-2026. The property sector's contribution to Chinese growth was already declining by 2018, suggesting deeper structural imbalances than policy tightening alone.
5. Data Analysis
This section presents primary economic data retrieved from the World Bank (via the World Bank Data360 connector), the Federal Reserve Economic Data (FRED) database, and cross-referenced with OECD and IMF assessments. The data spans 2000–2024 (annual) and 2000–2026 (monthly where available), providing 20+ years of historical context for trend analysis.
5.1 GDP Growth: Structural Deceleration
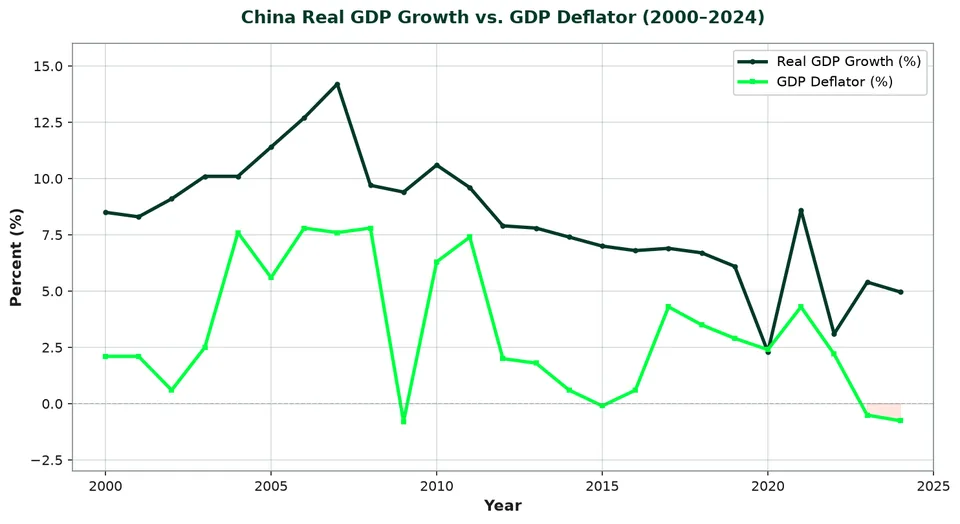
China's real GDP growth has undergone a clear structural deceleration over the past two decades. From double-digit growth in the 2000s (peaking at 14.2% in 2007), growth has progressively declined: 10.6% in 2010, 7.0% in 2015, 6.1% in 2019, 2.3% in 2020 (COVID), 8.6% in 2021 (rebound), 3.1% in 2022, 5.4% in 2023, and 4.96% in 2024 (WB WDI). The trajectory is unmistakably downward, with the 2024 figure representing roughly one-third of the 2007 peak.
This deceleration reflects the maturation of the economy, the exhaustion of catch-up growth opportunities, declining returns on investment, and the structural headwinds from the property downturn and demographic aging. The sell-side consensus for 2026 (4.1–4.8%) suggests the deceleration is continuing, albeit at a more gradual pace.
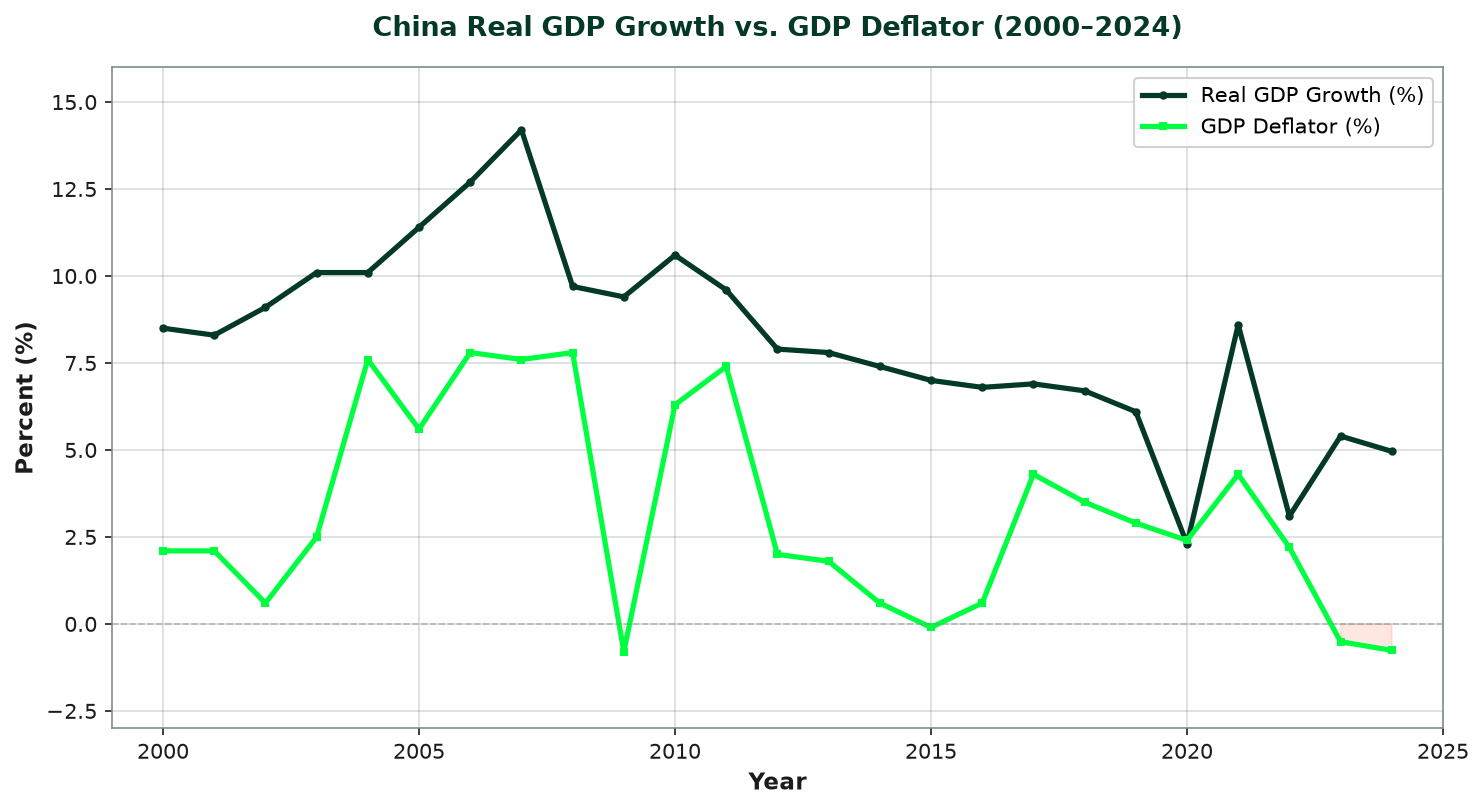
Figure 1: China Real GDP Growth vs. GDP Deflator (2000–2024). Source: World Bank WDI (WB_WDI_NY_GDP_MKTP_KD_ZG, WB_WDI_NY_GDP_DEFL_KD_ZG). The GDP deflator turned negative in 2023–2024, marking China's most sustained deflationary episode in decades.
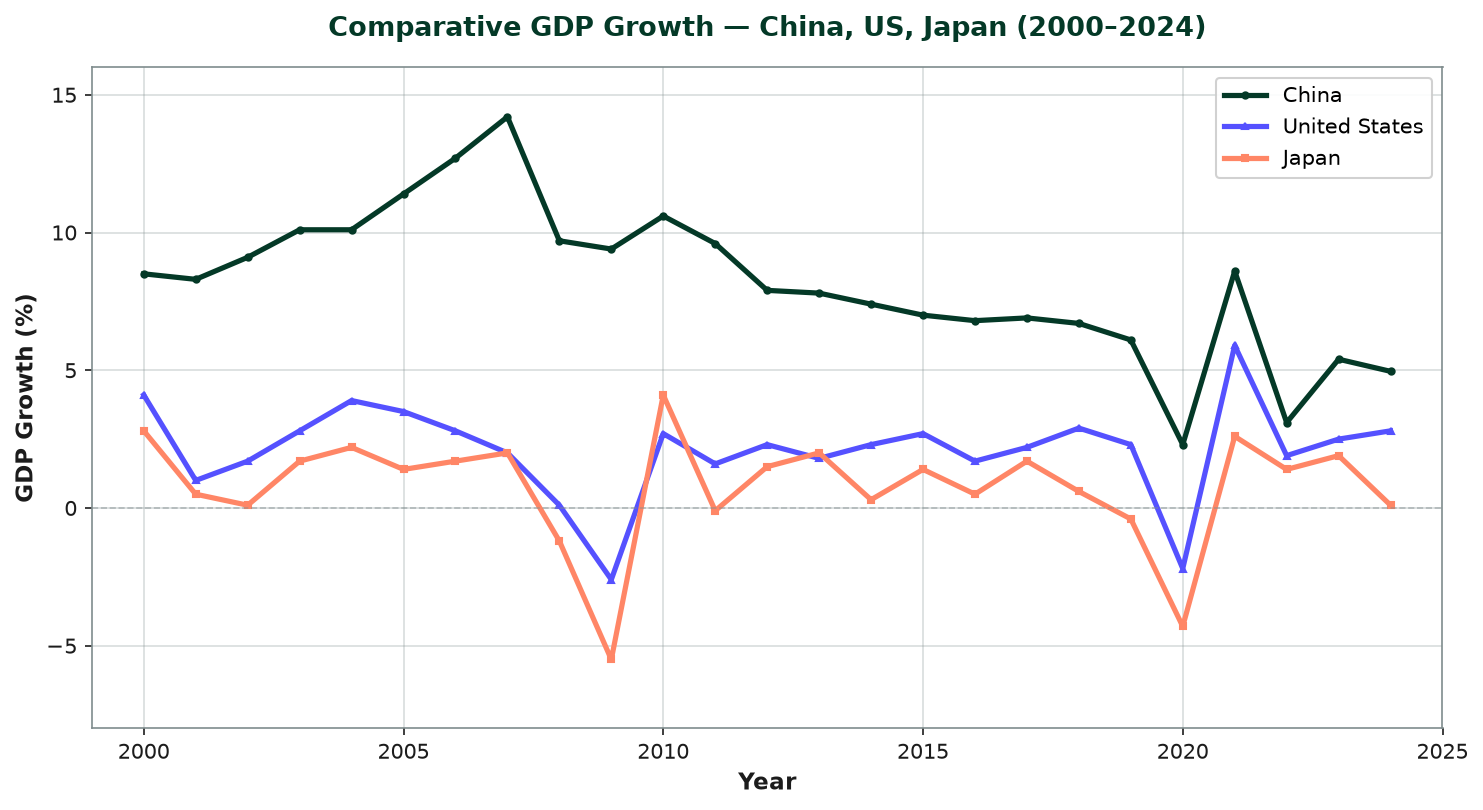
Figure 2: Comparative GDP Growth — China, US, Japan (2000–2024). Source: World Bank WDI (WB_WDI_NY_GDP_MKTP_KD_ZG). China's growth premium over advanced economies has narrowed significantly, converging toward levels more typical of middle-income economies.
5.2 Deflation: The GDP Deflator Turns Negative
The most striking data point is the GDP deflator, which turned negative in 2023 (−0.51%) and 2024 (−0.76%) after decades of positive readings (WB WDI: WB_WDI_NY_GDP_DEFL_KD_ZG). This is the broadest measure of economy-wide prices and its move into negative territory confirms that China is experiencing genuine deflation, not just disinflation. The IMF's Article IV Consultation estimates the deflator at −1% for 2025 and projects −0.7% for 2026.
Consumer price inflation has also collapsed, from 5.9% in 2008 and 5.6% in 2011 to just 0.22% in 2024 (WB WDI: WB_WDI_FP_CPI_TOTL_ZG). The near-zero CPI readings — combined with negative PPI readings for over three years — paint a picture of an economy with persistent excess supply and weak demand.
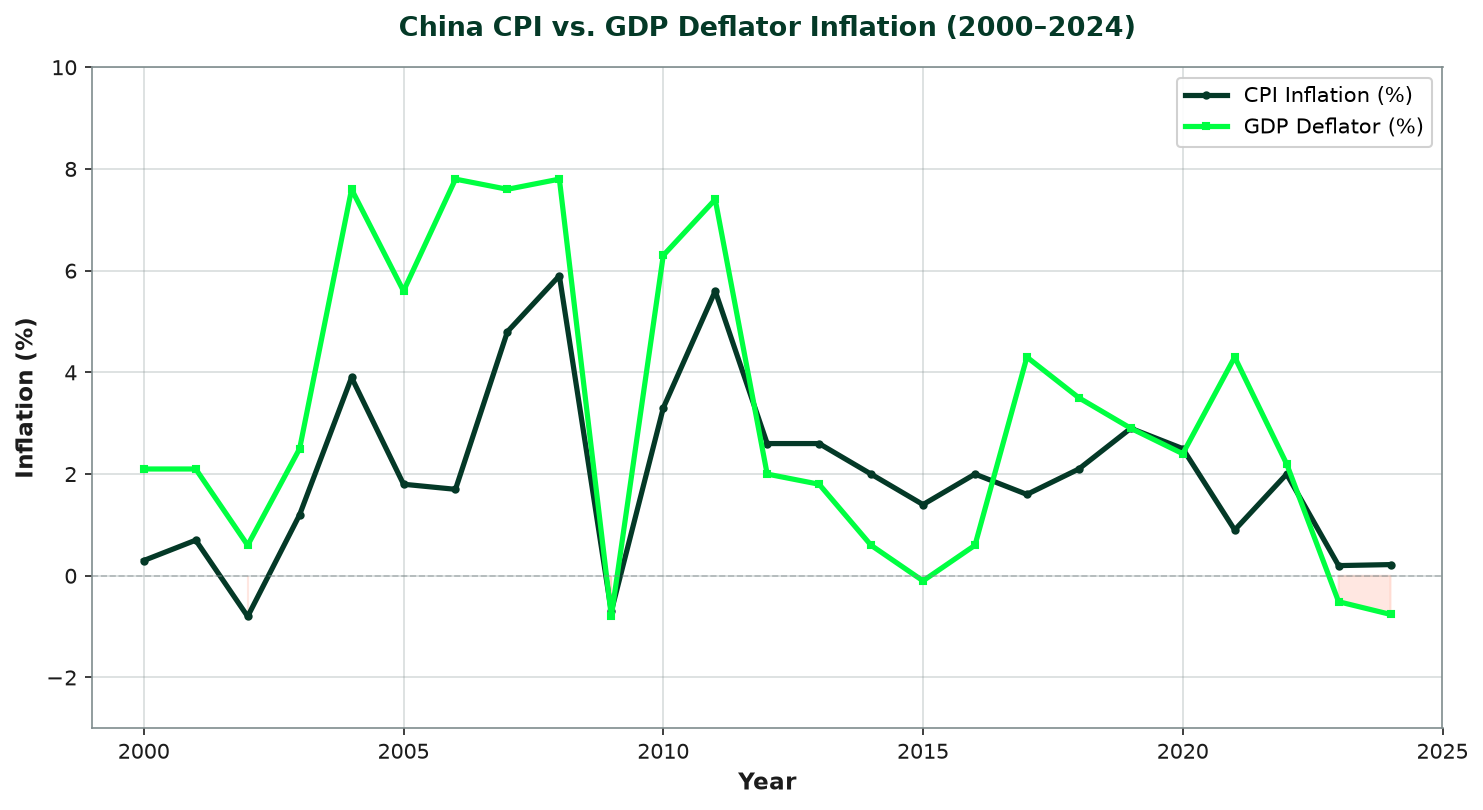
Figure 3: China CPI vs. GDP Deflator Inflation (2000–2024). Source: World Bank WDI (WB_WDI_FP_CPI_TOTL_ZG, WB_WDI_NY_GDP_DEFL_KD_ZG). Both CPI and the GDP deflator have collapsed toward or below zero, signaling entrenched deflationary pressures.
5.3 The Structural Imbalance: Consumption vs. Investment
The root cause of China's deflation lies in its structural imbalance between consumption and investment. Household consumption as a share of GDP was just 39.97% in 2024, compared to 67.91% in the US and 53.07% in Japan (WB WDI: WB_WDI_NE_CON_PRVT_ZS). This extraordinarily low consumption share — which fell from 46.75% in 2000 to a trough of 34.6% in 2010 before partially recovering — means that a disproportionate share of economic output goes to investment and net exports rather than household spending.
Gross capital formation as a share of GDP was 40.48% in 2024, down from peaks of 46.3% in 2010–2011 but still extraordinarily high by international standards (WB WDI: WB_WDI_NE_GDI_TOTL_ZS). This investment-heavy structure generates excess capacity, suppresses returns, and — when domestic demand is insufficient to absorb the output — results in either deflation at home or trade surpluses abroad.
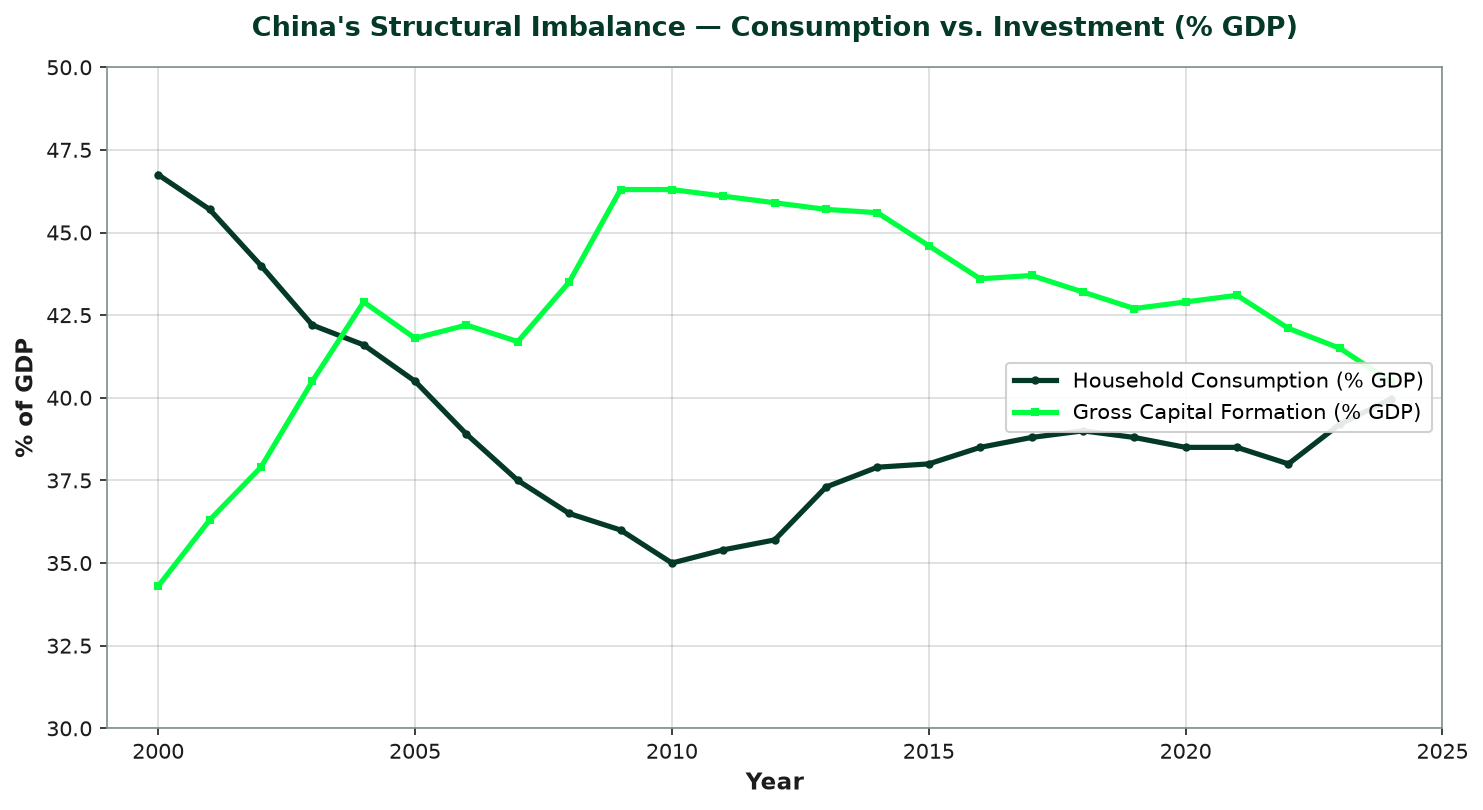
Figure 4: China's Structural Imbalance — Consumption vs. Investment (% GDP). Source: World Bank WDI (WB_WDI_NE_CON_PRVT_ZS, WB_WDI_NE_GDI_TOTL_ZS). China's investment share remains exceptionally high while consumption remains structurally low — the core imbalance driving deflation and trade surpluses.
5.4 Trade Dependency and Export Surge
China's exports as a share of GDP have fluctuated significantly, from 20.7% in 2000 to a peak of 35.5% in 2006, declining to 18.1% in 2019, and rebounding to 20.4% in 2024 (WB WDI: WB_WDI_NE_EXP_GNFS_ZS). The post-pandemic rebound in exports reflects both the redirection of supply chains and the competitive advantage gained from falling export prices. China's export prices have fallen ~20% since 2021 while its share of global exports rose from ~12% to ~18%.
5.5 US-China Trade Reconfiguration
FRED data on bilateral trade reveals a dramatic reconfiguration. US imports from China (FRED: IMPCH) reached a peak of approximately $47.7 billion per month in early 2022, fell to $35.8 billion in January 2024, partially recovered to $41.8 billion in January 2025, and then dropped sharply to $21.1 billion in January 2026 — reflecting the impact of escalated US tariffs. US exports to China (FRED: EXPCH) peaked around $13 billion/month in 2021–2023 and have since declined to $8.3 billion in January 2026.
5.6 Data Cross-Validation
Cross-validation of GDP data across sources shows strong consistency. World Bank WDI reports 4.96% GDP growth for 2024, while official Chinese statistics report "around 5%" and the OECD and IMF forecasts for 2025–2026 are in the 4.1–4.8% range. The key discrepancy is between official figures and independent assessments: Rhodium Group estimates actual growth at 2.4–2.8% for 2024, well below the official ~5%, while Capital Economics similarly estimates the economy is growing "much more slowly" than reported. This gap is a critical consideration for investors relying on Chinese economic data.
| Indicator | Source | Code | Latest | Value |
|---|---|---|---|---|
| GDP Annual % Growth | World Bank WDI | WB_WDI_NY_GDP_MKTP_KD_ZG | 2024 | 4.96% |
| GDP Deflator Inflation | World Bank WDI | WB_WDI_NY_GDP_DEFL_KD_ZG | 2024 | −0.76% |
| CPI Inflation | World Bank WDI | WB_WDI_FP_CPI_TOTL_ZG | 2024 | 0.22% |
| Exports % of GDP | World Bank WDI | WB_WDI_NE_EXP_GNFS_ZS | 2024 | 20.44% |
| Gross Capital Formation % GDP | World Bank WDI | WB_WDI_NE_GDI_TOTL_ZS | 2024 | 40.48% |
| Household Consumption % GDP | World Bank WDI | WB_WDI_NE_CON_PRVT_ZS | 2024 | 39.97% |
| US Imports from China | FRED | IMPCH | Jun 2026 | $25.1B/mo |
| US Exports to China | FRED | EXPCH | Jun 2026 | $9.6B/mo |
6. Impact Analysis
China's sluggish growth and deflation transmit to the global economy through multiple channels: commodity demand, manufacturing competition, trade reconfiguration, financial markets, and geopolitical realignment. This section distills the implications for specific sectors and geographies, drawing on the expert perspectives, market intelligence, historical precedents, and primary data analyzed in the preceding sections.
6.1 Commodities — The Demand Channel
The most direct and immediate transmission channel is through commodity demand. China is the world's largest consumer of many industrial commodities, and its property and construction sectors drive a disproportionate share of global demand for steel, iron ore, copper, and coking coal. The 2012–2015 precedent is instructive: when Chinese fixed-asset investment decelerated, copper fell 40%, oil 60%, and iron ore 70%.
The current environment is already producing similar effects. Benchmark iron ore has spent extended periods below the psychologically important $100/tonne mark, at $94.75/t in mid-2026, as Chinese property sector deleveraging crushes steel demand. Construction accounts for over 30% of China's steel demand, and the transmission chain runs from property developer stress to reduced new construction starts, to reduced steel demand, to reduced iron ore and coking coal imports, to reduced global benchmark prices.
- Iron ore: Australia (sends 25–40% of exports to China), Brazil — direct exposure to construction demand
- Copper: Chile, Peru, DRC — exposed to Chinese industrial and infrastructure demand
- Crude oil and coal: China's imports dropped in 2025, underlining fragile domestic demand
- Sub-Saharan Africa: Growth fell from 5.3% (2013) to 1.3% (2016) during the last China investment slowdown; a deeper shock would be worse
- Australia: Iron ore is where China's domestic weakness hits export income most directly
6.2 Global Manufacturing — The Competition Channel
China's deflation is being exported through falling prices of manufactured goods. With export prices down ~20% since 2021 and its share of global exports up from ~12% to ~18%, China is intensifying competitive pressure on manufacturers worldwide. China now accounts for 28% of global manufacturing output, up from 5% in 2000. Its manufacturing capacity is often 2x or more than current production, setting the stage for years of low-cost exports.
Sectors most exposed to Chinese price competition include electric vehicles (EVs), solar and clean energy, steel and aluminum, batteries and energy storage, and intermediate goods and components. Nearly 30% of Chinese industrial firms operate at a loss, up from 20% before COVID; in sectors prioritized under "Made in China 2025," that number is as high as 34%. Rather than allowing failing firms to exit, local governments prop up unprofitable companies, and state banks roll over debt — perpetuating the overcapacity that fuels deflationary exports.
6.3 Advanced Economy Consumers — The Deflation Import Channel
For commodity-importing and consumer-facing economies, Chinese deflation carries mixed signals. Falling Chinese export prices act as a positive supply shock for importing nations — lowering input costs and consumer prices. However, this also signals weak Chinese consumer demand, which is negative for luxury goods exporters, commodity producers, and regional manufacturing exporters who depend on Chinese end-demand.
The net effect on global inflation is disinflationary. China's deflationary pressures contribute to lower global goods prices, potentially complicating central banks' inflation targets in advanced economies — though the magnitude depends on the degree of trade frictions and tariff barriers that may insulate some markets from Chinese price competition.
6.4 Trade Reconfiguration and Supply Chains
The FRED data on US-China bilateral trade (IMPCH, EXPCH) reveals a dramatic reconfiguration. US imports from China fell from $47.7B/month (early 2022) to $21.1B/month (January 2026), while US exports to China declined from $13B/month to $8.3B/month. This reflects the cumulative impact of US tariffs and the broader "de-risking" of supply chains.
As the US share of China's exports has declined, shipments to emerging markets have risen to around 45% from 34% in 2016. This shift reflects a rerouting of goods previously destined for the US. China has also increased investment and offshore production in several emerging markets, moving up the value chain in clean energy, EVs, batteries, robotics, biotechnology, and AI. For investors, this means supply chain exposure to China is increasingly indirect, routed through Southeast Asia, Mexico, and other emerging markets.
6.5 Financial Markets and Capital Flows
China's deflation and structural slowdown transmit to financial markets through several channels:
- Earnings downgrades: Companies reliant on Chinese demand see earnings downgraded, reducing stock market value and increasing corporate bond spreads
- Bank exposure: Banks with significant exposure to China-dependent companies face higher bad-loan risk, raising financial stability concerns
- Commodity-linked bonds: China's deflationary pressure reduces global commodity demand, pressuring producer countries and their government bond spreads
- Capital flows: When profit expectations are revised downward, investors pull out of riskier assets, influencing currency moves and yield differentials that can spread into funding markets
- Chinese equities: JPMorgan projects another year of Chinese equity underperformance in 2026, as structural imbalances offset cyclical support
6.6 Sector Impact Summary
| Sector / Region | Impact Direction | Severity | Primary Channel |
|---|---|---|---|
| Iron ore / Steel (Australia, Brazil) | Negative | High | Property construction demand collapse |
| Copper (Chile, Peru, DRC) | Negative | High | Industrial & infrastructure demand |
| EVs & Clean Energy (Global) | Mixed | Moderate | Chinese export price competition |
| Luxury Goods (Europe) | Negative | Moderate | Weak Chinese consumer demand |
| Western Manufacturing (US, EU) | Negative | High | Deflationary export competition |
| Commodity-Importing Consumers | Positive | Low | Lower input costs, cheaper goods |
| Emerging Market Exporters (ASEAN, LatAm) | Mixed | Moderate | Trade rerouting vs. Chinese competition |
| Chinese Equities | Negative | High | Structural imbalance, earnings pressure |
| AI / High-Tech Supply Chains | Positive | Low | Export surge in AI hardware, semiconductors |
| Sub-Saharan Africa | Negative | High | Commodity demand, trade dependence |
7. Conclusions and Outlook
China's sluggish growth and deflation represent a structural transition, not a cyclical dip. The confluence of a multi-year property downturn, industrial overcapacity, structurally low household consumption, and an export-driven growth model has produced the most sustained deflationary episode in decades — with the GDP deflator at −0.76% in 2024 and projected to remain negative through 2026. This is the predictable consequence of a growth model that, as Michael Pettis argues, has relied on ever-increasing credit expansion to maintain GDP targets above sustainable levels.
The global implications are profound and operate through multiple channels. Commodity exporters face a diminished "Chinese bid" — the 2012–2015 precedent saw copper, oil, and iron ore fall 40–70%. Global manufacturers confront intensifying price competition from deflationary Chinese exports, with export prices down ~20% since 2021 and China's share of global exports up to ~18%. Financial markets must price the risk that earnings downgrades, bank exposures, and capital flow reversals could, in an adverse scenario, transmit China's deflation as a global shock.
Key Takeaways for Investors
- Commodity exposure warrants caution: Iron ore, copper, and energy exporters to China face structural demand headwinds that are unlikely to reverse in the near term
- Manufacturing sectors face continued deflationary pressure: EVs, solar, steel, and batteries are sectors where Chinese overcapacity will sustain price competition for years
- Consumer-facing exposure to Chinese demand is weakening: Luxury goods, tourism, and premium consumer brands dependent on Chinese consumers face a diminished growth market
- Supply chain diversification is accelerating: The FRED trade data confirms a sharp reconfiguration of US-China bilateral trade; investors should assess indirect China exposure through emerging market rerouting
- Chinese equities face structural headwinds: JPMorgan projects continued underperformance as imbalances offset cyclical support; selective opportunities exist in AI and high-tech supply chains
- Deflationary spillovers benefit some importers: Commodity-importing economies and consumers benefit from lower input costs, though this complicates inflation dynamics
- Data reliability is a risk factor: The gap between official growth figures (~5%) and independent estimates (2.4–2.8%) is material and should inform risk assessment
The historical parallels — China's own 1998–2002 deflation, the 2008 stimulus aftermath, and especially Japan's lost decade — suggest that China's adjustment will be prolonged. The window to shape a favorable outcome is narrowing as overcapacity, weak consumption, and negative sentiment reinforce one another. Without a fundamental rebalancing toward household consumption — which economists across the spectrum identify as the necessary but politically difficult reform — the deflationary pressures and their global spillovers are likely to persist.
China's structural slowdown and deflation are not transitory. They represent a multi-year transition that will continue to reshape global commodity markets, manufacturing competition, trade flows, and financial risk pricing. Portfolio positioning should reflect the persistence of these forces: underweight direct commodity exporters to China, assess manufacturing sector exposure to Chinese price competition, monitor supply chain reconfiguration, and remain alert to the tail risk of a more severe global deflationary shock.
8. References
[1] K. Rogoff and Y. Yang. "A Tale of Two Countries – The Real Estate Crises in 1990s Japan and Contemporary China." NBER Working Paper No. 35054. 2026.
[2] K. Rogoff and Y. Yang. "China's real estate reckoning: Lessons from Japan's lost decade." CEPR VoxEU Column. May 2026.
[3] M. Pettis. "My Disagreement with The Economist." Michael Pettis Substack. March 9, 2026.
[4] Capital Economics. "Deflation at home, disruption abroad – China's growth model is a lose-lose." Capital Economics Blog. 2026.
[5] M. Froman. "The Next Global Economic Crisis Could Be Made in China." Foreign Affairs. August 13, 2026.
[6] Goldman Sachs Research (H. Shan). "China's Economy is Expected to Grow 4.8% in 2026 Amid Surging Exports." Goldman Sachs Insights. January 8, 2026.
[7] Discovery Alert. "ASX Commodities & China Slowdown: Key Risks 2026." July 17, 2026.
[8] M. Pettis. "Is Inflation a Monetary Phenomenon in China?" Carnegie Endowment for International Peace. August 21, 2024.
[9] M. Pettis. "Domestic continuities between China Shock 1.0 and China Shock 2.0." Michael Pettis Substack. July 31, 2026.
[10] E. Prasad. "Chinese Deflation Would Be Bad for the World. Beijing May Not Stop It." Barron's. August 9, 2023.
[11] CNBC. "Relying on exports is 'dangerous' for China: Eswar Prasad." June 2, 2025.
[12] E. Prasad. "China's Growth Prospects." April 2023.
[13] Stanford SCCEI. "China's Property Slump Can Curb Growth for Years, Even Without a Banking Crisis." 2026.
[14] JPMorgan. "The Year of the Trojan Fire Horse: China's imbalanced economy and unrelenting mercantilism." Eye on the Market 2026.
[15] Li Daokui. "China's Biggest Economic Problem Is Not K-Shaped Divergence, but an Economy That Is Cold." August 2026.
[16] Goldman Sachs Research (H. Shan). "China's Economy is Forecast to Grow Faster Than Expected in 2026." November 21, 2025.
[17] JPMorgan Asset Management. "China: The growing 'news' and receding 'olds'." December 12, 2025.
[18] JPMorgan Asset Management. "China 2Q26 GDP: Growth slowdown strengthens the case for policy support." July 21, 2026.
[19] Hellenic Shipping News. "BofA raises China inflation forecast on demand, energy, AI tailwinds." March 24, 2026.
[20] Tradevae. "BofA Lifts Global Growth Forecasts as Energy Risks Ease." June 28, 2026.
[21] Morgan Stanley. "Key Themes for 2026." Morgan Stanley Investment Management. 2026.
[22] Fitch Ratings. "China's Domestic Demand Weakness to Limit Growth to 4.1% in 2026." January 22, 2026.
[23] Fitch Ratings. "China Deflation Eases but Weak Domestic Demand Could Weigh on Prices." August 26, 2026.
[24] OECD. "China: OECD Economic Outlook, Volume 2026 Issue 1." June 3, 2026.
[25] IMF. "People's Republic of China: 2025 Article IV Consultation." IMF Country Report. February 18, 2026.
[26] Rhodium Group. "China's Economy: Rightsizing 2025, Looking Ahead to 2026." December 22, 2025.
[27] Asian Development Bank. "ADB Forecasts Resilient GDP Growth in the PRC in 2026, a Pick Up in Inflation." Asian Development Outlook April 2026. April 10, 2026.
[28] Brookings Institution. "A tale of two countries." March 25, 2026.
[29] SteelMath. "China's Steel Deflation Chain: CPI, PPI, Ore Below $100." August 12, 2026.
[30] Mapshock. "Chinese Economic Growth Deceleration and Demand Shock: Impact on US-Americas Export Markets." July 17, 2026.
[31] Reuters. "China's May exports slow, deflation deepens as tariffs bite." June 2026.
[32] Various. Consumer price impact analysis. 2026.
[33] Various. Financial market transmission analysis. 2026.
[34] Various. Q2 2026 deflation snap analysis. 2026.
[35] Politburo. "July 2026 Politburo Meeting Statement." July 2026.
This research memorandum is provided for informational purposes only and does not constitute investment advice, an offer to sell, or a solicitation to buy any securities. The analysis and views herein are based on publicly available information, proprietary AI models, and data from the World Bank, Federal Reserve Economic Data (FRED), OECD, IMF, and other cited sources.
Past performance is not indicative of future results. All investments involve risk, including possible loss of principal. This report does not provide economic policy recommendations. The securities, sectors, and geographic regions discussed may not be suitable for all investors. Investors should conduct their own due diligence and consult with financial advisors before making investment decisions.
Data from the World Bank WDI was retrieved via the World Bank Data360 connector (indicators WB_WDI_NY_GDP_MKTP_KD_ZG, WB_WDI_NY_GDP_DEFL_KD_ZG, WB_WDI_FP_CPI_TOTL_ZG, WB_WDI_NE_EXP_GNFS_ZS, WB_WDI_NE_GDI_TOTL_ZS, WB_WDI_NE_CON_PRVT_ZS). FRED data was retrieved via the FREDClient API (series IMPCH, EXPCH). All data is sourced and dated for citation purposes. Cross-validation was performed where sources overlap.
SkyWise Research and its affiliates may hold positions in securities, sectors, or geographic regions discussed in this report. This report is intended solely for institutional and accredited investors.
SkyWise Research | Research Department
September 2, 2026
Powered by AI-First Analysis
Frequently Asked Questions
Is China's economic slowdown cyclical or structural?
China's current economic challenges represent a structural transition, not a cyclical dip. The confluence of a multi-year property downturn, industrial overcapacity, structurally low household consumption (just 39.97% of GDP), and an export-driven growth model has produced the most sustained deflationary episode in decades, with the GDP deflator at −0.76% in 2024.
How does China's deflation affect global markets?
China's deflation transmits globally through multiple channels: commodity demand (iron ore, copper, oil), manufacturing price competition (export prices down ~20% since 2021), trade reconfiguration (US imports from China fell from $47.7B to $21.1B/month), and financial markets (earnings downgrades, bank exposures, capital flow reversals). The 2012-2015 precedent saw copper fall 40%, oil 60%, and iron ore 70%.
What is the comparison between China's current situation and Japan's lost decade?
Research by Rogoff and Yang (NBER Working Paper 35054) draws striking parallels between China's current real estate adjustment and Japan's 1990s experience, including demographics (China aging faster), overdevelopment, housing wealth effects (70% of household wealth), and investment overhang. Key differences include China's state-dominated financial system and state-owned land, but the core dynamics of durable housing overhang are similar.
What should investors know about China's growth forecasts?
Sell-side consensus (Goldman Sachs, JPMorgan, BofA, Fitch, OECD) projects 4.1-4.8% GDP growth for 2026 with deflation gradually easing but persistent through 2027. However, independent estimates from Rhodium Group and Capital Economics suggest actual growth may be 2.4-2.8%, well below official figures. This data reliability gap is a critical risk factor for investors.
Published Sep 2, 2026 and not updated since. Personal views, not investment advice. See Disclosures.