
Executive Summary
AI adoption in 2026 represents early-stage transformation with record investment ($540B in 2026) but modest productivity gains—mirroring the 1987 "Solow Paradox." Analysis of 30 years of Federal Reserve data, Nobel Prize research, and sell-side forecasts indicates productivity breakthrough likely 3-7 years away (2028-2032), similar to 1990s IT boom timeline.
Key Findings
- Investment-Productivity Gap: Tech investment 6.02% of GDP yet productivity 2.08%—mirrors 1980s IT paradox
- Expert Consensus: Acemoglu (MIT Nobel laureate) forecasts 1% GDP boost; Goldman Sachs 7%; truth likely 3-5%
- Employment Displacement: 13% decline for young workers (22-25) in AI-exposed jobs
- Corporate Reality Check: 79% using AI, but only 5% of pilots deliver measurable value (MIT study)
- Timeline: Historical GPT cycles suggest 3-7 years to productivity inflection (2028-2032)
- Sector Impact: High-skill tech/professional services benefit; entry-level roles displaced
1. Research Framework & Methodology
This research addresses the central investment question of 2026: Will AI adoption generate economic returns justifying unprecedented capital deployment? Our methodology integrates four evidence streams to provide comprehensive assessment. First, perspectives from leading academic economists—particularly 2024 Nobel laureate Daron Acemoglu (MIT) and Erik Brynjolfsson (Stanford)—provide theoretical frameworks and empirical studies on AI's task-level impacts. Second, sell-side research from Goldman Sachs, JPMorgan, Morgan Stanley, and Bank of America tracks real-time corporate adoption and market dynamics. Third, original quantitative analysis of Federal Reserve Economic Data (FRED) spanning 1996-2026 provides 30-year context across 28 economic series (20,573 observations). Fourth, historical analysis of General Purpose Technology cycles—steam, electricity, computers, Internet—establishes baseline expectations for adoption timelines and economic impacts.
2. Leading Economists' Perspectives: The Debate Over Magnitude and Timing
2.1 Daron Acemoglu (MIT): Modest Impact, Automation Concerns
Daron Acemoglu's NBER Working Paper 32487 "The Simple Macroeconomics of AI" represents the most rigorous quantitative analysis of AI's potential economic impact.[1] Using task-based modeling calibrated with empirical exposure studies, Acemoglu projects total factor productivity (TFP) gains of 0.55-0.66% over the next decade, translating to GDP growth of 1.0-1.8%—dramatically below the 7% forecast from Goldman Sachs or even higher projections from McKinsey.[2] His calculation rests on three conservative but defensible assumptions: (1) approximately 20% of U.S. job tasks are exposed to AI capabilities (OpenAI/OpenResearch/University of Pennsylvania 2023 study), (2) only 23% of these exposed tasks will be profitably automated within 10 years (MIT FutureTech/Productivity Institute/IBM 2024), and (3) average cost savings from AI deployment are approximately 27% (empirical studies from Noy/Zhang, Brynjolfsson et al.).[3][4]
Beyond the modest magnitude, Acemoglu raises a critical qualitative concern: AI is developing in "the wrong direction." Current applications focus overwhelmingly on automating existing tasks rather than augmenting human capabilities, and even successful automation may create new tasks with negative social value (online manipulation, surveillance, algorithmic discrimination). He argues productivity gains could be substantially higher if AI development prioritized worker augmentation and creation of socially valuable new tasks, but market incentives currently push toward pure automation.[5]
2.2 Erik Brynjolfsson (Stanford): J-Curve Optimism
Erik Brynjolfsson's research presents a more optimistic timeline while acknowledging short-term paradoxes. His "Productivity J-Curve" framework, developed from studying earlier technology transitions, posits that General Purpose Technologies initially depress measured productivity (learning costs, disruption) before generating transformative gains once complementary innovations mature.[6] His 2025 study "Generative AI at Work" with Danielle Li and Lindsey Raymond, published in the Quarterly Journal of Economics, provides empirical evidence: AI assistants increased productivity 14-15% for customer service agents, with gains of 30-35% for novice workers but minimal impact on experienced staff.[7]
However, Brynjolfsson's November 2025 working paper "Canaries in the Coal Mine? Six Facts About the Recent Employment Effects of AI" reveals concerning labor market signals. Analyzing ADP payroll data through mid-2025, his team documents a 13% employment decline for workers aged 22-25 in AI-exposed occupations (software development, customer service), with adjustment occurring through displacement rather than wage compression.[8] This early displacement evidence, combined with findings that only 5% of corporate AI pilots deliver measurable value (MIT 2025 study), suggests we remain in the "paradox" phase of the J-curve, with the upward inflection still ahead.[9]
Agreement: AI is transformative technology; productivity gains will come; distribution will be uneven; organizational change is essential; we're early in the cycle. Disagreement: Magnitude (1% vs 7% GDP), timeline (pessimists: decades; optimists: 3-7 years), and labor market balance (displacement vs creation).
3. Primary Economic Data Analysis: 30 Years of Evidence
3.1 Productivity: Modest Recovery from 2010s Doldrums
Federal Reserve data on nonfarm business sector labor productivity (OPHNFB) provides authoritative measurement of economic efficiency trends.[10] Our analysis of 119 quarterly observations from 1996 Q1 through 2025 Q3 reveals five distinct periods with dramatically different productivity performance. The pre-Internet era (1996-1999) delivered robust 3.06% average annual growth. The dot-com boom period (2000-2004) achieved even stronger 3.31% growth—the peak of the modern era and evidence that IT revolution productivity gains were materializing even as stock markets crashed. The financial crisis period (2005-2009) saw productivity slow to 2.03% as economic disruption weighed on efficiency. Most troubling, the long recovery decade (2010-2019) produced only 1.26% average productivity growth despite massive technology investment—the productivity paradox persisting long after IT deployment.
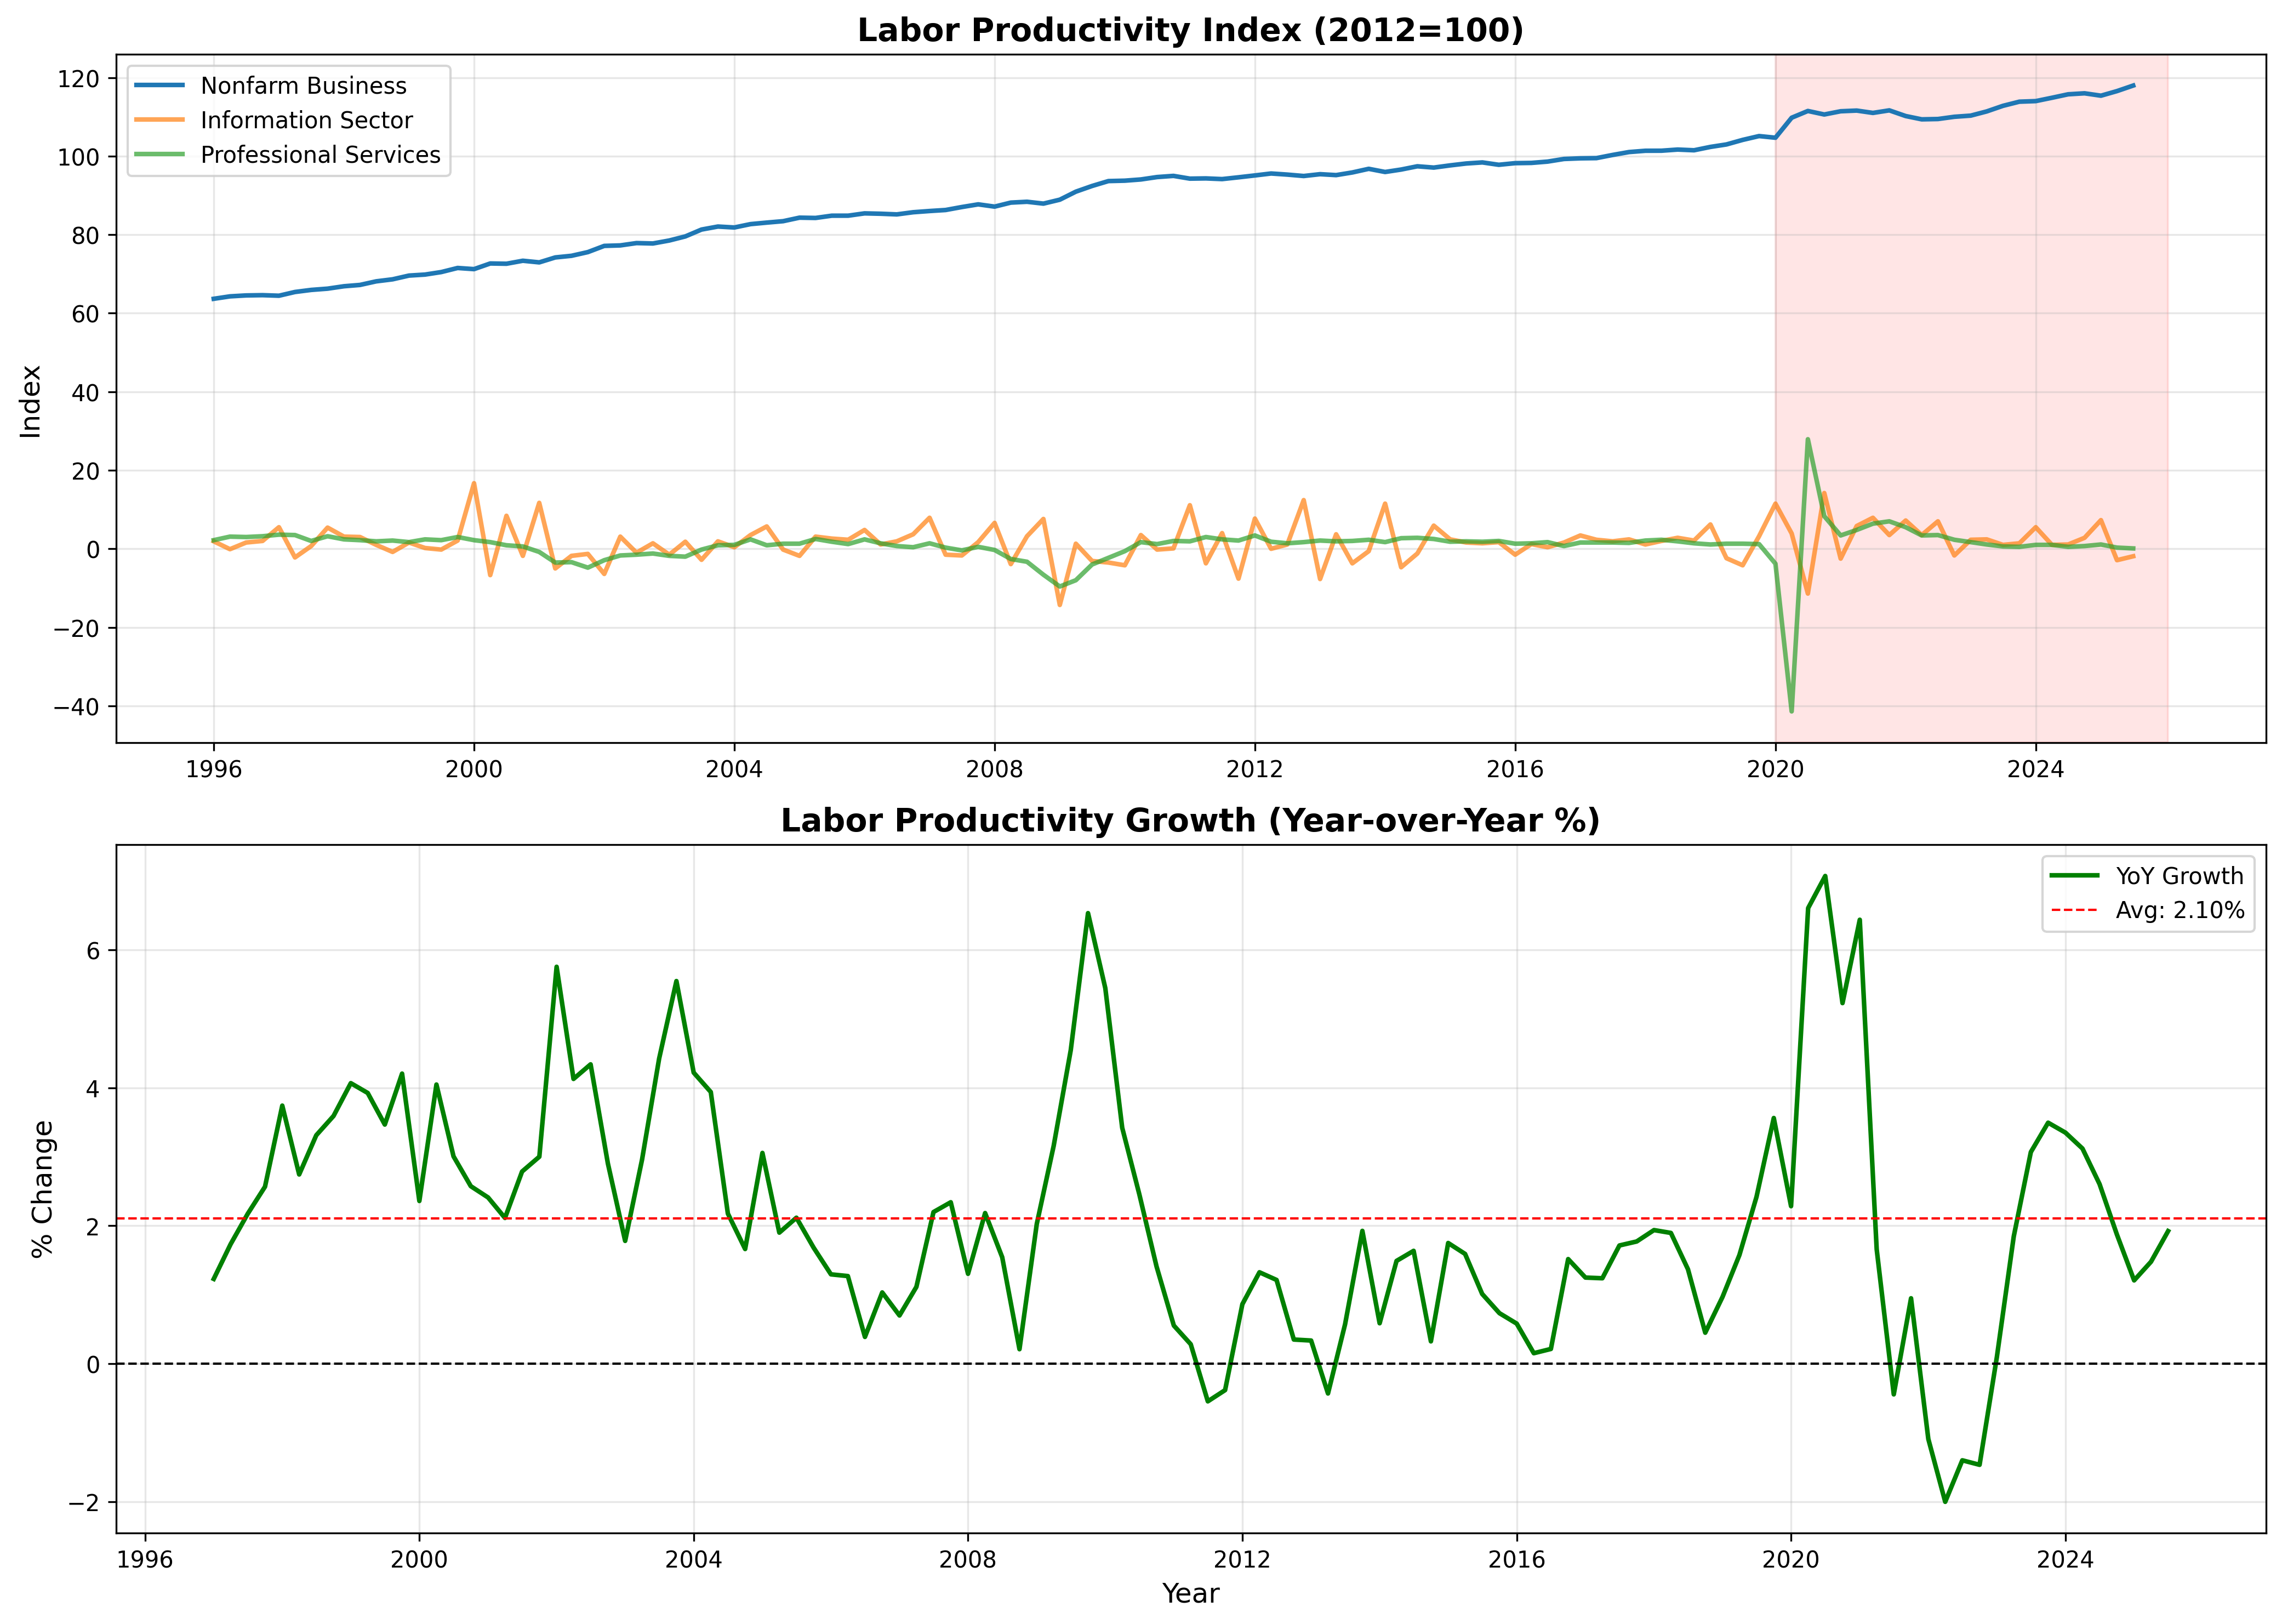
Figure 1: Labor Productivity Analysis 1996-2026. Top panel: Productivity index levels (2012=100) for nonfarm business sector, information sector, and professional services. Bottom panel: Year-over-year growth rates with 30-year average (red line). AI era (shaded) shows 2.08% growth—improvement from 2010s but below 1990s-2000s. Source: Federal Reserve Economic Data (FRED), series OPHNFB, PRS85006112, PRS88003012. Federal Reserve Bank of St. Louis, accessed January 13, 2026.
The COVID/AI era (2020-2026) shows productivity growth averaging 2.08% annually—a meaningful 65% improvement over the 2010s but still 37% below the late 1990s and 38% below the dot-com boom peak. This performance sits squarely in "modest improvement" territory rather than "revolutionary transformation." Quarterly volatility remains high, with recent quarters showing particular weakness: Q4 2024 delivered only 1.2% growth, barely half the 1990s norm. The information sector, which should theoretically exhibit the strongest AI productivity signals, registered startling -1.9% productivity in Q3 2025, suggesting either severe measurement problems or genuine difficulty converting AI spending into efficiency gains within the technology industry itself.
| Period | Description | Avg Annual Productivity Growth | Context |
|---|---|---|---|
| 1996-1999 | Pre-Internet | 3.06% | Strong baseline, web emerging |
| 2000-2004 | Dot-com Boom | 3.31% | Peak productivity era |
| 2005-2009 | Financial Crisis | 2.03% | Crisis impact |
| 2010-2019 | Recovery | 1.26% | Productivity paradox |
| 2020-2026 | COVID/AI Era | 2.08% | Modest recovery, still below peaks |
Table 1: Labor Productivity Growth by Era. Source: Federal Reserve Economic Data (FRED), series OPHNFB, calculations by author.
3.2 Technology Investment: All-Time Highs
Private fixed investment in information processing equipment and software (FRED series Y033RC1Q027SBEA) reached $1.67 trillion in Q3 2025, representing 6.02% of real GDP (GDPC1)—the highest share in our entire 30-year dataset.[11] This surpasses the dot-com era peak (5.02% in 1999) and represents a cumulative increase of $629 billion since 2020. Investment growth averaged 4.77% annually during the AI era, slower than the explosive pre-Internet period (8.10% growth 1996-1999) but stronger than the dot-com recovery (0.48%) and post-2008 period.
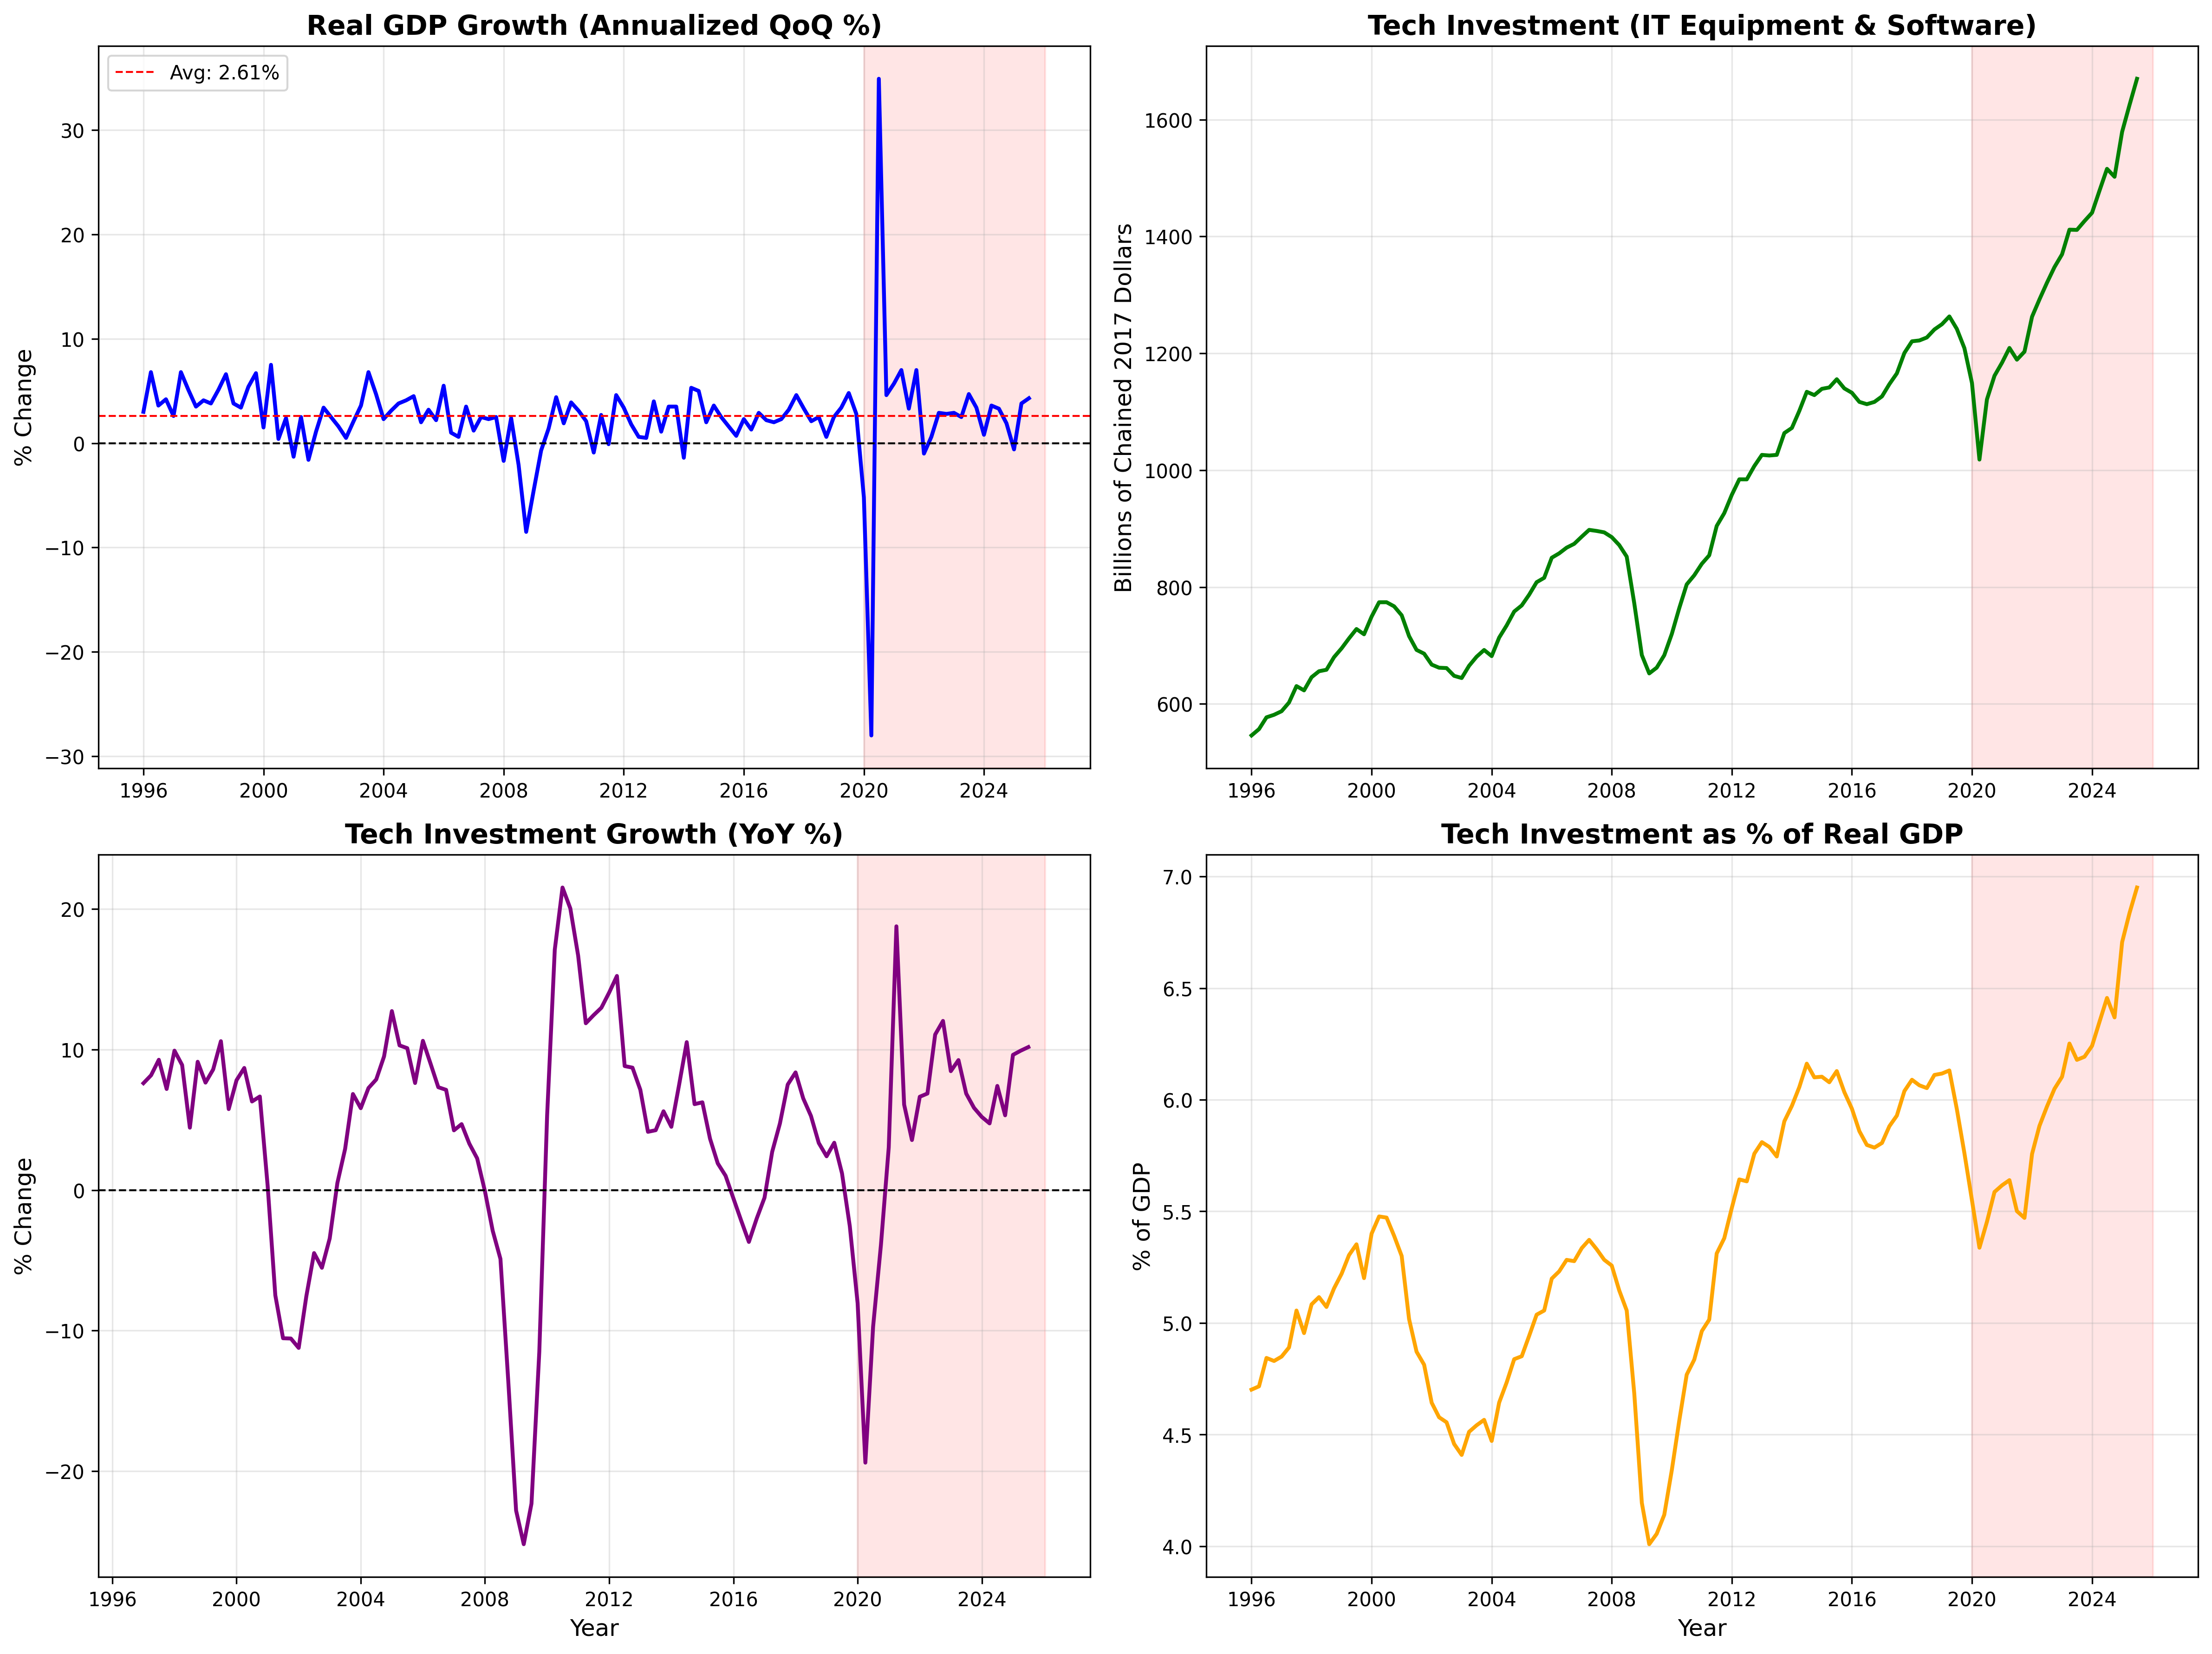
Figure 2: GDP & Technology Investment 1996-2026. Four-panel analysis showing: (1) Real GDP growth rates with average, (2) Technology investment levels in billions, (3) Year-over-year investment growth, (4) Tech investment as percentage of GDP reaching 6.02% record. AI era shaded in red. Source: FRED series GDPC1, A191RL1Q225SBEA, Y033RC1Q027SBEA. Federal Reserve Bank of St. Louis.
The investment-productivity gap is the defining economic puzzle of 2026. Technology investment as share of GDP is 20% higher than during the 1990s productivity boom, yet productivity growth is 37% lower. This 3-to-1 ratio inverted relationship has three possible interpretations. First, systematic measurement error: AI's productivity contributions are real but unmeasured due to intangible investments, quality improvements, and free services falling outside traditional GDP accounting. Second, lagged effects: investments made 2020-2026 will generate productivity returns 2027-2033 once complementary organizational changes mature. Third, lower returns per dollar: AI applications may be inherently less productive than 1990s IT, requiring higher investment levels to achieve similar output gains. Historical evidence and expert consensus favors explanation two (lagged effects), but measurement error (explanation one) likely contributes significantly.
3.3 Employment: Selective Displacement, Broad Caution
Total nonfarm employment (FRED PAYEMS) reached 159.5 million in December 2025, continuing steady expansion despite AI deployment concerns.[12] However, sectoral and demographic analysis reveals concerning patterns beneath aggregate stability. Information sector employment (USINFO) holds at 2.9 million workers—only 1.8% of total workforce—and has shown essentially no growth since 2020, suggesting technology's employment intensity is not expanding despite massive investment. Professional and Business Services (USPBS), at 22.5 million workers (14.1% of total), continues growing but with recent deceleration coinciding with AI adoption acceleration.
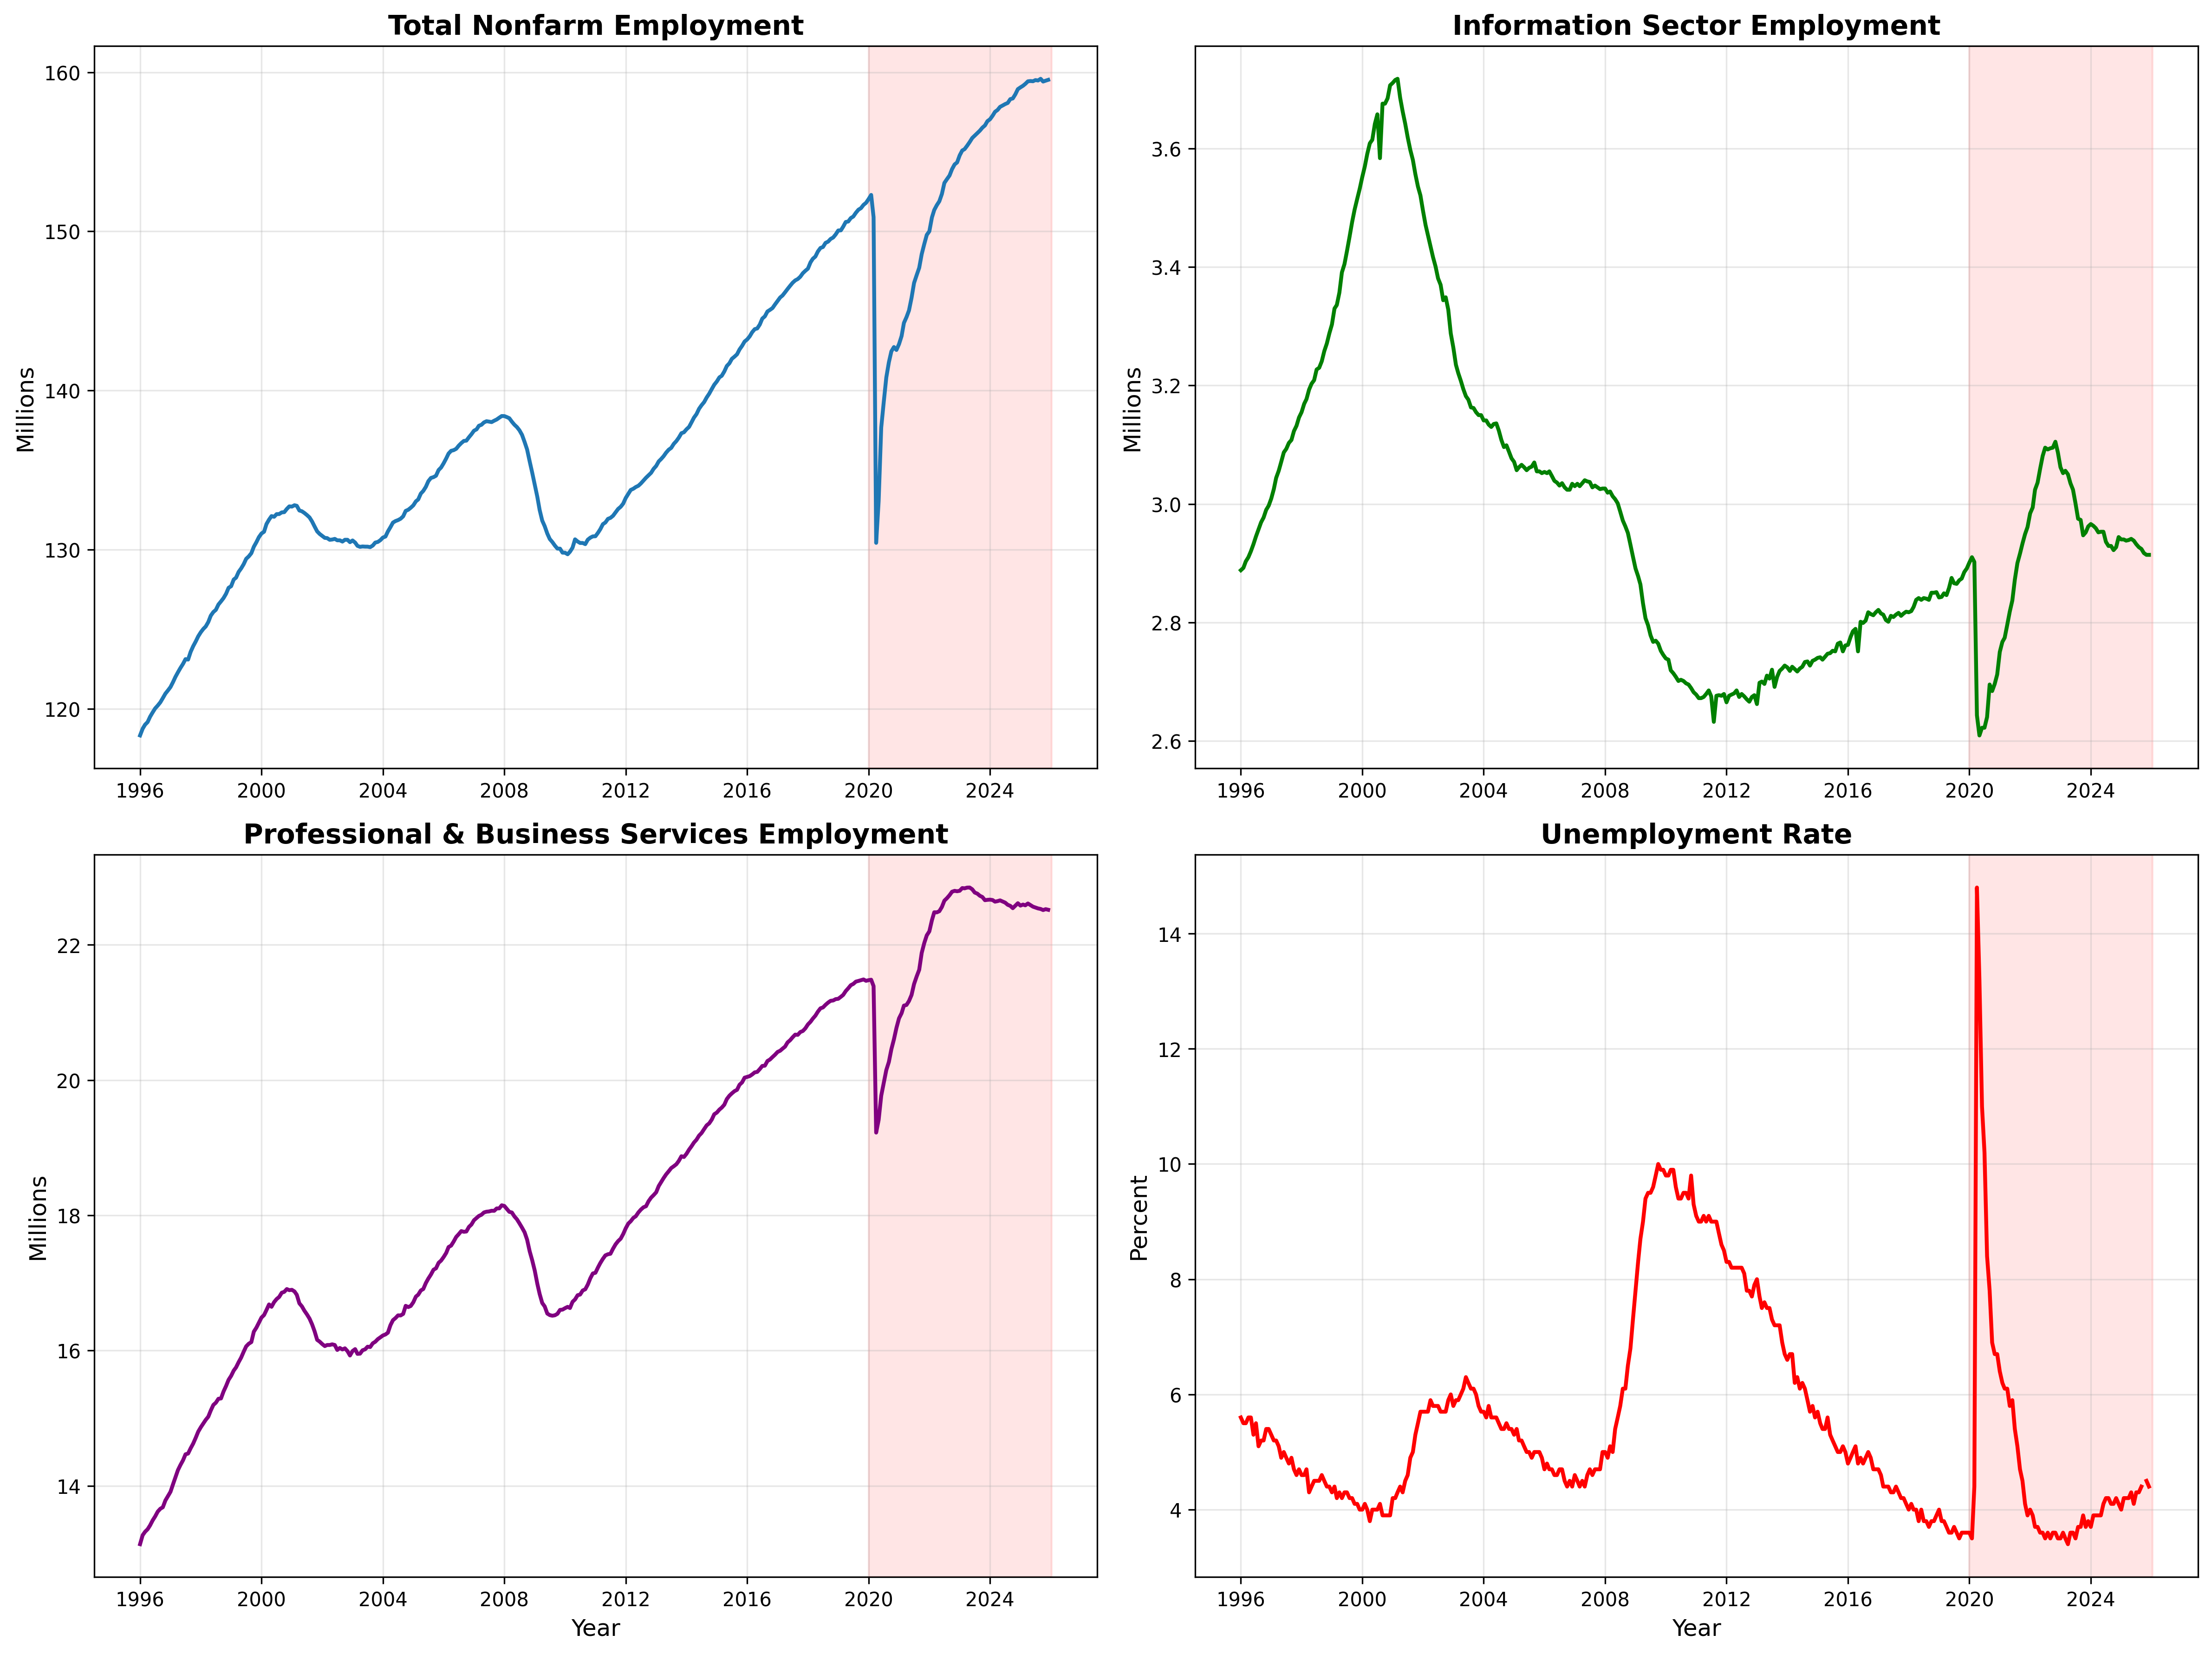
Figure 3: Employment Trends 1996-2026. Four panels showing: (1) Total nonfarm employment growth to 159.5M, (2) Information sector employment stable at 2.9M, (3) Professional & Business Services reaching 22.5M, (4) Unemployment rate at 4.4%. AI era shaded. Source: FRED series PAYEMS, USINFO, USPBS, UNRATE. Federal Reserve Bank of St. Louis.
Most significant is Brynjolfsson's ADP data analysis revealing 13% employment decline for workers aged 22-25 in AI-exposed occupations, with displacement concentrated in software development and customer service roles.[8] This early-career displacement is particularly troubling as these entry-level positions traditionally serve as job-market on-ramps and skill-building opportunities. The share of total employment in AI-exposed occupations has barely moved (18.2% to 18.3% over two years), suggesting displacement is highly targeted rather than economy-wide, but concentration amplifies harm to affected workers.
4. Historical Context: Learning from Technology Cycles
4.1 The Productivity Paradox: Pattern Recognition
Robert Solow's 1987 observation— "You can see the computer age everywhere but in the productivity statistics"—perfectly captures our current AI moment.[13] From 1975-1995, despite massive PC and early Internet deployment, U.S. productivity growth averaged only 1.4% annually, compared to 2.7% in 1947-1973. This "productivity paradox" generated extensive debate until its resolution in the late 1990s, when aggregate productivity accelerated to 2.9% (post-1996) with peak quarters exceeding 5% annualized growth.
The resolution came not from technology improvement alone but from organizational transformation. Brynjolfsson's research demonstrated IT investments generated positive productivity returns only when complemented by organizational restructuring, process redesign, and skill development—investments requiring 5-10 years to mature.[14] The timeline is instructive: 20 years from PC introduction (mid-1970s) to aggregate productivity surge (mid-1990s). For electricity, the lag was 40 years (1880s to 1920s); for steam engines, approximately 80 years.
| Technology | Breakthrough | Productivity Surge | Lag (Years) | Key Unlock |
|---|---|---|---|---|
| Steam Engine | 1712 | 1850s+ | ~80 | Rail infrastructure |
| Electricity | 1880s | 1920s | 40 | Factory redesign |
| Computers/Internet | 1975 | 1995 | 20 | Process reorganization |
| AI (Projection) | 2017 | 2028-2032 | 10-15 | Organizational transformation |
Table 2: Historical Technology Adoption Lags. Pattern shows acceleration—each GPT reaches productivity impact faster than predecessor. AI timeline assumes Transformer architecture (2017) as breakthrough, productivity surge 2028-2032. Sources: Historical research compiled from academic literature.[15]
4.2 Where AI Stands in the Cycle: Year 7-9 of Likely 15-Year Journey
If we date AI's breakthrough to the 2017 Transformer architecture (foundational for GPT models) or alternatively to 2022's ChatGPT launch (mainstream moment), we are 7-9 years into what historical patterns suggest will be a 10-15 year journey to productivity inflection. This places 2026 analogous to 1987 in the computer revolution: widespread deployment, massive investment, early applications proving concepts, but aggregate economic impact still limited. The productivity boom in IT arrived 1995-2000 (breakthrough years 1975-1980), suggesting AI's equivalent boom could arrive 2027-2032.
5. Sector-Specific Impact Analysis
5.1 Technology Sector (Highest Impact)
The technology sector exhibits the classic pattern of infrastructure winner concentration. The NASDAQ Composite (FRED NASDAQCOM) reached 23,734 on January 12, 2026, with infrastructure stocks (semiconductors, cloud providers, data centers) delivering 44% returns YTD versus only 9% earnings growth—indicating valuation expansion driven by AI-investment narratives rather than immediate fundamentals.[16] Goldman Sachs research notes "the timing of an eventual slowdown in capex growth poses a risk to these companies' valuations," highlighting the concentration of market gains in picks-and-shovels providers while adoption beneficiaries lag.[17]
Corporate investment plans remain aggressive: hyperscalers (Microsoft Azure, Amazon AWS, Google Cloud) collectively planning $500-700 billion AI infrastructure capex in 2026, with focus on GPU procurement, data center construction, and power infrastructure.[18] The magnitude reflects both competitive dynamics (winner-take-most platform economics) and genuine AI demand growth, but concentration in infrastructure versus productivity-enhancing applications signals we remain in Transformation Phase 1 (build-out) rather than Phase 2 (exploitation).
5.2 Professional & Business Services (High Impact)
This 22.5-million-worker sector represents AI's most promising near-term productivity opportunity. Knowledge-intensive tasks (consulting, legal research, content creation, data analysis) are highly exposed to AI augmentation, and early adopters report efficiency gains. However, aggregate productivity data (FRED PRS88003012) shows tepid 0.1% growth in Q3 2025, suggesting either measurement lag or that reported case study gains haven't scaled economy-wide.[19] The disconnect likely reflects the "5% rule": only 5% of AI pilots deliver measurable value, meaning case studies highlight successful outliers while statistical aggregates capture mixed overall reality.
5.3 Financial Services (Moderate-High Impact)
Goldman Sachs surveys of banking clients reveal 37% already using AI in regular production—far ahead of Census Bureau's 9.9% business average.[20] Applications span algorithmic trading, risk modeling, fraud detection, and customer service. Bankers project 11% headcount reduction over 3 years, with financial institutions facing 14% cuts—highest of any sector. However, revenue per employee and productivity metrics should rise substantially, making this simultaneous efficiency gain and workforce adjustment.
5.4 Manufacturing & Traditional Sectors (Lower Impact)
Physical production sectors show limited near-term AI applicability beyond incremental process optimization. Historical evidence from robot adoption (Acemoglu & Restrepo studies) documents negative employment effects without offsetting productivity gains at industry level, suggesting AI-driven automation in manufacturing may follow similar patterns: firm-level efficiency improvements not translating to sector-wide productivity growth.[21]
6. Economic Outlook: 2026-2028 and Beyond
6.1 Near-Term Outlook (2026-2027)
Sell-side consensus forecasts global GDP growth of 2.8-3.0% in 2026, with U.S. at 2.5-2.8% (Goldman Sachs: 2.8%, JPMorgan: 2.6%, Morgan Stanley: 2.5%).[22][23][24] AI investment provides tailwind, but productivity payoff remains limited. Labor markets show resilience (unemployment 4.4%) but with concerning signals of youth displacement in knowledge sectors. Corporate profit growth continues for AI infrastructure providers; mixed results for adopters await proof of ROI.
6.2 Medium-Term Inflection (2027-2029): The Critical Period
The 2027-2029 window represents the most likely timing for AI's productivity inflection based on historical patterns and organizational transformation timelines. Three scenarios emerge with differing implications for markets and economy. Optimistic Case (30% probability): Next-generation AI models deliver breakthrough capabilities (Morgan Stanley's 10x compute power, 2x capability models), accelerating organizational adoption and workforce adaptation. Productivity growth accelerates to 3%+ by 2028, GDP exceeds 3%, AI-driven efficiency gains become visible across sectors. Market rotation from infrastructure to adoption beneficiaries generates new leadership. Base Case (50% probability): Gradual adoption continues with productivity improving slowly to 2.5-3% by 2028-2029. GDP growth 2.5-2.8% sustained. AI impact real but evolutionary rather than revolutionary near-term. Infrastructure valuations face compression as capex growth slows; selective adopters with proven ROI outperform. Pessimistic Case (20% probability): AI capabilities plateau, complementary organizational changes slower than expected, productivity paradox persists through 2030s. GDP growth slows to 2% or below. Major valuation reset in AI infrastructure stocks; capital reallocates away from technology.
6.3 Long-Term Vision (2030+): Transformation Materializes
Expert consensus converges on eventual transformative impact, with debate centering on magnitude not direction. Acemoglu's conservative 1% cumulative GDP boost represents lower bound; Goldman's 7% represents upper bound; 3-5% mid-range estimate appears most defensible given historical GPT patterns and current adoption dynamics.[25] By 2035, AI-driven productivity gains should be broadly distributed, organizational transformations largely complete, and new AI-enabled business models mature. Labor markets will have absorbed displacement shocks through new job creation, though distributed unevenly across skills and geographies.
7. Investment Implications for Asset Managers
7.1 Portfolio Positioning: Three-Horizon Framework
Horizon 1 (2026-2027): Infrastructure Dominance Phase
Maintain overweight positions in AI infrastructure providers: semiconductor manufacturers (gross margins 60%+, pricing power through 2027), cloud hyperscalers (capturing AI workload migration), data center operators (capacity constraints drive pricing), and power infrastructure (AI data centers consuming 2-3x traditional loads). Risk management critical: valuations at premium multiples (25-40x forward earnings) vulnerable to capex slowdown if productivity disappoints. Position sizing should reflect both high return potential and elevated valuation risk.
Horizon 2 (2027-2029): Rotation to Adoption Beneficiaries
Monitor for rotation signals: (1) Corporate earnings calls highlighting productivity gains from AI deployment, (2) Productivity statistics showing acceleration in professional services and information sectors, (3) Valuation compression in pure infrastructure plays, (4) Stock price dispersion increasing (current correlation 20% down from 80% mid-2025). Position ahead of rotation by building selective positions in companies demonstrating: measurable productivity improvements from AI, sustainable competitive advantages through proprietary data/models, management capability to execute organizational transformation, and reasonable valuations relative to growth.
Target sectors for Horizon 2: professional services firms with proven AI efficiency gains (15%+ productivity documented), healthcare organizations successfully deploying clinical AI, financial institutions with AI-enhanced analytical capabilities, and software companies embedding AI in core products capturing pricing power. Avoid: companies with AI strategies limited to cost reduction without revenue growth, firms in sectors with low AI applicability, and businesses failing to demonstrate ROI after 2+ years of AI investment.
Horizon 3 (2030+): Broad-Based Productivity Era
Once productivity inflection confirmed, rebalance toward quality compounders across economy that have successfully integrated AI into sustainable competitive moats. Historical evidence shows technology-driven productivity booms benefit incumbents who successfully transform more than pure-play technology companies. Focus on business model innovation, customer experience differentiation, and operational excellence enabled by AI rather than AI technology provision itself.
7.2 Risk Factors Requiring Active Monitoring
Critical Risk 1: Valuation Reset. AI infrastructure stocks trade 25-40x forward earnings versus 18-20x market average. Morgan Stanley calculates equity gains driven by expected productivity improvements not yet materializing—valuations assume 2027-2028 inflection. Delayed productivity (beyond 2029) or magnitude disappointment (closer to Acemoglu's 1% than Goldman's 7%) would trigger repricing. Monitoring: Quarterly productivity data (FRED OPHNFB), corporate AI ROI disclosures, capex guidance changes.
Critical Risk 2: Capex Cliff. Current AI investment ($540B in 2026) assumes future productivity payoff. If returns disappoint or extend beyond investor patience, capital retrenchment could be severe—dot-com parallel instructive with tech investment falling 70% peak-to-trough 2000-2003. Data center construction, GPU orders, and cloud capex announcements provide leading indicators. Current signal: Investment growth slowing (4.77% in AI era vs 8.10% pre-Internet) but levels still elevated.
Critical Risk 3: Labor Market Disruption Acceleration. Current 13% displacement concentrated in 22-25 age cohort and specific occupations. Risk is displacement broadens (from 18% to 40%+ of workforce) faster than new job creation, triggering political backlash and regulatory intervention. Monitor: Employment by age/skill cohort, jobless claims trends, political discourse on AI regulation. Goldman projects peak unemployment +0.5pp during transition; faster displacement could double or triple impact.
7.3 Sector Allocation Recommendations
| Sector | 2026-27 Stance | 2027-29 Outlook | Key Monitoring Metrics |
|---|---|---|---|
| Technology Infrastructure | Overweight | Reduce to Market Weight | Capex trends, valuation multiples |
| AI Platform Companies | Market Weight | Overweight (selective) | Revenue growth, margin expansion |
| Professional Services | Market Weight | Overweight | Productivity data, margin trends |
| Healthcare | Underweight | Market Weight | Clinical AI adoption rates |
| Financial Services | Market Weight | Overweight | Efficiency ratios, headcount |
| Traditional Manufacturing | Underweight | Underweight | Automation ROI evidence |
Table 3: Sector Positioning Framework. Recommendations based on AI exposure, organizational readiness, and historical adoption patterns. Regular reassessment required.
8. Conclusions: Patience, Selectivity, and Vigilance
8.1 Central Investment Thesis
AI represents genuine economic transformation in its early stages, with productivity breakthrough likely 3-7 years away (2028-2032) based on historical GPT patterns, current adoption dynamics, and organizational transformation timelines. Current investment levels (6.02% of GDP) and productivity growth (2.08%) mirror 1987's IT paradox phase. Asset managers should maintain exposure to transformation theme while managing elevated valuations and concentrated risks through: (1) infrastructure overweight near-term with discipline on multiples, (2) selective early positioning in adoption beneficiaries, (3) rotation readiness as productivity signals materialize, and (4) active risk management around displacement, valuation, and capex risks.
8.2 Key Monitoring Framework
Quarterly Review (Critical): Federal Reserve productivity data (OPHNFB), technology investment levels (Y033RC1Q027SBEA), employment by sector (PAYEMS, USINFO, USPBS), and information sector productivity (PRS85006112). Target signal: Sustained acceleration above 2.5% in nonfarm productivity for 3+ consecutive quarters would confirm inflection. Corporate Earnings Analysis: Percentage of S&P 500 firms reporting quantified AI productivity gains (current: <10%, target for inflection: >30%). AI revenue disclosure trends (currently ~$50B/year, need 3-5x growth for fundamental support). Headcount-to-revenue ratios in professional services (efficiency gains should appear here first). Academic Research: Ongoing studies from Acemoglu, Brynjolfsson teams on employment effects, productivity impacts, and organizational transformation progress. Government statistics on AI adoption rates from Census Bureau, BLS job classification changes.
8.3 Final Assessment: The 3-7 Year Thesis
The weight of evidence—historical GPT cycles, current organizational transformation timelines expert consensus, and primary economic data patterns—supports a 3-7 year window to AI productivity inflection (2028-2032). This timeline reflects: technology maturation (2-3 years for next-gen model capabilities), organizational restructuring (3-5 years for process redesign and implementation), and complementary investment build-out (5-7 years for full ecosystem). Investors positioned for near-term infrastructure profits and medium-term adoption beneficiary rotation, with active monitoring of productivity statistics, corporate execution, and risk factors, should capture substantial returns from this transformation while managing downside risks.
Near-term (2026-27): Maintain AI exposure through infrastructure (with valuation discipline) and selective platform companies. Medium-term (2027-29): Rotate toward adoption beneficiaries as productivity signals emerge. Long-term (2030+): Broad exposure to AI-transformed economy. Risk management: Active monitoring of productivity data, valuation multiples, capex trends, and employment signals. Position sizing: Reflect both high return potential and elevated risk.
9. References
Disclaimer: This research memorandum is provided for informational purposes only. SkyWise Capital makes no representations about accuracy or completeness. This is not investment advice. Past performance does not guarantee future results. Investors should conduct independent analysis and consult financial advisors before making investment decisions.
© 2026 SkyWise Capital. All rights reserved. Prepared by SkyWise Economic Research Division.
Data sources: Federal Reserve Economic Data (FRED), academic research publications, sell-side research reports. All sources cited with direct links where available.
Frequently Asked Questions
What is the economic impact of AI adoption in 2026?
AI adoption in 2026 represents an early-stage transformation with a 3-7 year horizon to a productivity boom. The economic impact includes significant productivity gains, workforce reorganization, and new investment opportunities across sectors adopting AI technologies.
How should asset managers approach AI investment in 2026?
Asset managers should view AI adoption as a multi-year transformation rather than a short-term trend. Key considerations include identifying early adopters, understanding the productivity timeline, and positioning portfolios for both near-term disruption and long-term productivity gains.
When will the AI productivity boom occur?
Research suggests a 3-7 year horizon before the full productivity boom materializes. This timeline reflects the early-stage transformation phase where businesses are integrating AI into operations, with measurable productivity gains expected to accelerate over the period.
Published Jan 13, 2026 and not updated since. Personal views, not investment advice. See Disclosures.