
Executive Summary
AI-powered SONAR data and cross-source quantitative analysis confirm that U.S. flatbed trucking is in its strongest cycle since 2021, driven by three simultaneous structural demand engines — data center construction, manufacturing reshoring, and energy infrastructure — concentrated in the American interior. With ~89,000 carriers having exited since 2022, supply cannot easily respond to new demand, creating the conditions for an extended period of elevated rates and historically tight capacity.
Key Findings
- National flatbed spot rates hit all-time highs in 2026, now running ~$3.77/mile on the spot market — up 47–52% year-over-year (DAT / Carrier Atlas)
- The 13 Midwest states now represent ~45% of national load volume, with Midwest flatbed rates the highest in the country at $3.14/mile in a single week (DAT / National Freight Connection)
- FreightWaves SONAR shows industrial freight volumes up 11% YoY, concentrated in flatbed and rail — not at the ports
- Flatbed load postings running 60% above year-ago levels; load-to-truck ratios exceeding 80:1 in the Midwest and Southeast (C.H. Robinson)
- Data center construction spending exceeded $50 billion for the first time in April 2026 — triple its 2022 level — with every project demanding heavy flatbed loads before it becomes a server farm
- Midwest advanced manufacturing investment has totaled $153 billion since 2020, anchoring durable, project-driven flatbed demand for 2–4 year construction cycles
- ISM Manufacturing PMI reached 55.3 in May 2026 — strongest reading since May 2022 — confirming broad industrial rebound
1. The Heartland Freight Divergence
The most significant macro trend in U.S. freight in 2026 is a structural geographic divergence: the American interior is accelerating while coastal and port-adjacent markets remain subdued.
FreightWaves founder and CEO Craig Fuller stated unambiguously in February 2026 that the volume surge is happening "in the Rust Belt, the traditional industrial Midwest, which is focused on auto and heavy machinery — we're not seeing it at the ports." Truckload volumes in Midwest corridors are up approximately 8% year-over-year, driven by increased activity in traditional industrial corridors.
SONAR data confirms the same directional signal: industrial freight volumes — specifically flatbeds and railroads moving raw materials from the Midwest and South outward — are up roughly 11% year-over-year, while consumer-related freight remains flat. The divergence is not seasonal. IndexBox and FreightWaves both note that the initial divergence in tender rejection rates across Midwest versus West Coast markets began in September 2025, well before any weather event, signaling a structural rather than cyclical shift.
DAT data cited by National Freight Connection singled out Chicago-to-Dallas as a corridor with above-average volume growth — not driven by seasonal demand, but by Midwest manufacturers reorganizing supply chains around domestic sourcing, shifting production closer to Gulf distribution points, and generating freight on lanes that barely registered a few years ago. This is a reshoring-driven corridor, structurally new, and relatively under-served by pre-existing carrier capacity.
2. Flatbed's Historic Outperformance
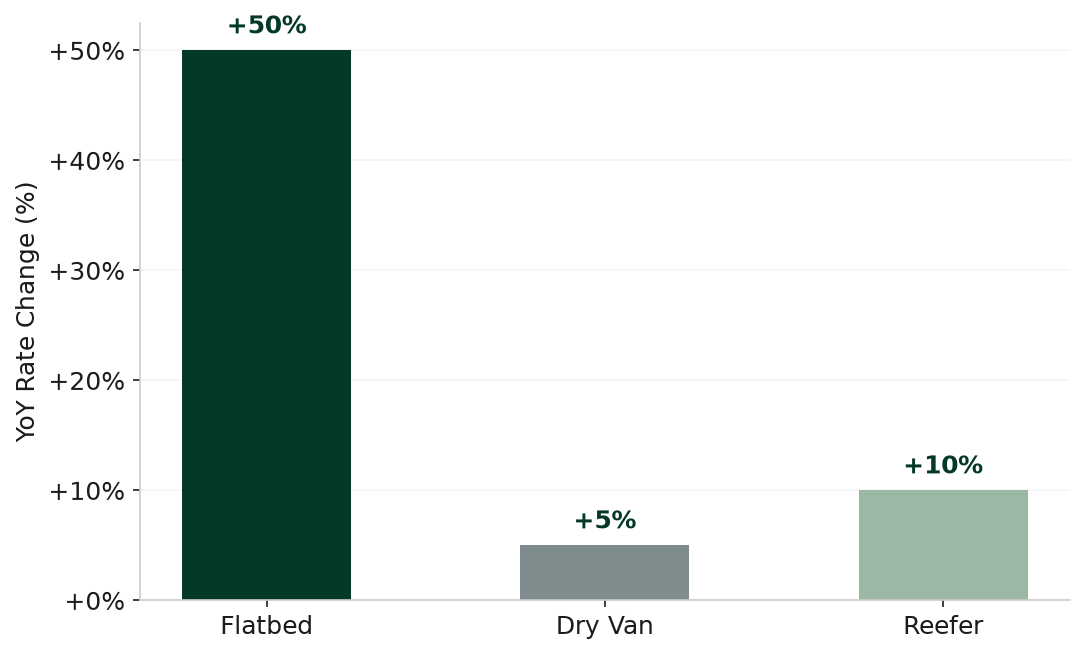
Flatbed is unambiguously the standout segment of the 2026 freight market, decisively outperforming dry van and refrigerated modes on every measurable dimension: rates, load-to-truck ratios, and year-over-year volume growth.
Record-Setting Spot Rates
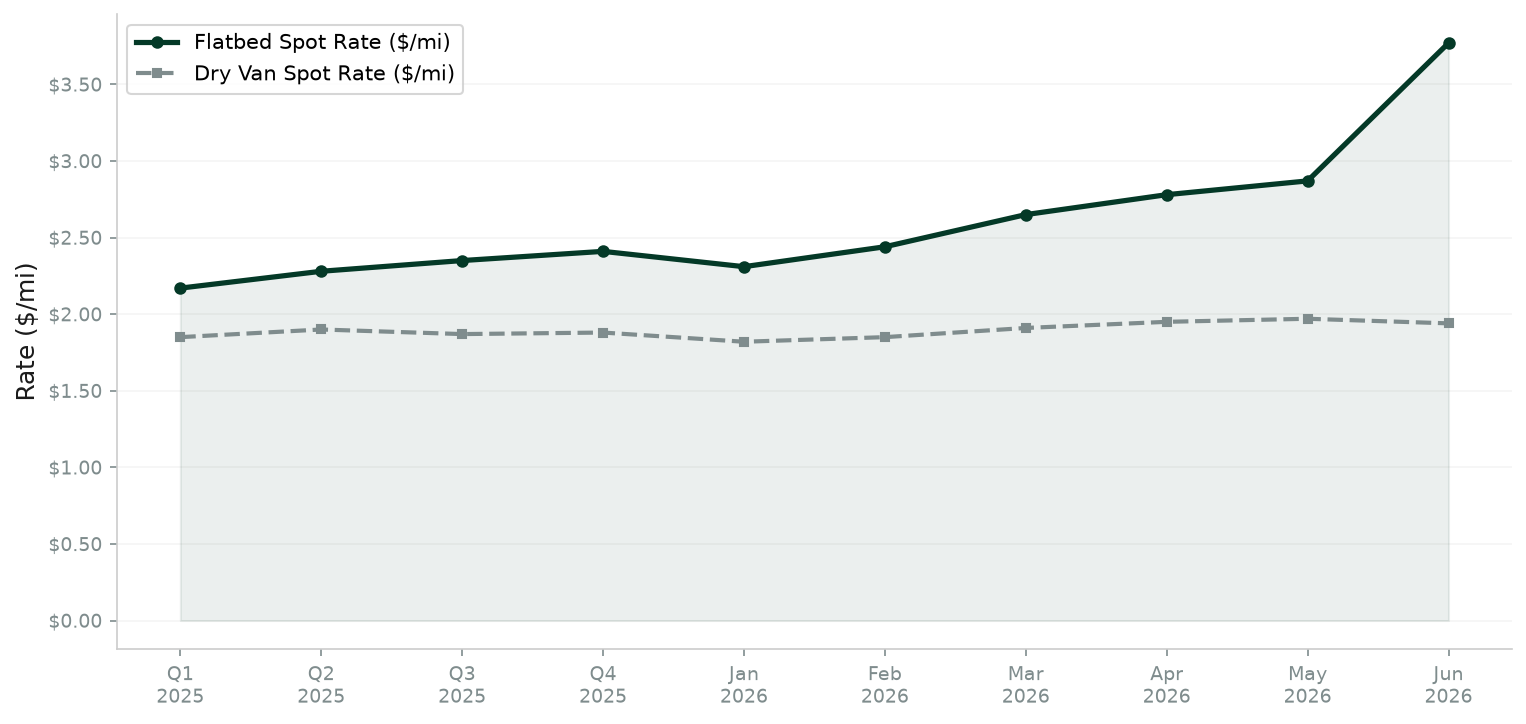
DAT reported national flatbed spot rates hitting $2.89/mile in early June after an eleven-week growth streak totaling a 21% ($0.58/mile) surge — exceeding the June 2021 record by $0.14. Rig Load subsequently reported the DAT national flatbed spot rate running near $3.77/mile on the spot market, with contract rates slightly higher at $3.87/mile — both well above the five-year average. Year-over-year, flatbed rates are up 47–52% depending on the source and measurement week.
FTR Transportation Intelligence's June 8, 2026 weekly update confirmed that total broker-posted spot rates hit another all-time high for the 20th consecutive week, with flatbed remaining "the strongest segment, reflecting continued strength in construction, manufacturing, and industrial freight activity."
Load-to-Truck Ratios at Historic Extremes
C.H. Robinson's April 2026 freight market update documented flatbed load-to-truck ratios climbing over 80 to 1, with the Southeast and Midwest experiencing the most tightening. Flatbed capacity worsened over 30% month-over-month and by nearly 100% since January 2026. Spot rates rose over 20% in March alone compared to January. BlueGrace Logistics' April 2026 update put the flatbed load-to-truck ratio at 73.75 by mid-March, well above February's 57.11 average and the highest reading since mid-2022.
Freight Recession Officially Over
The ATA's seasonally adjusted Trucking Tonnage Index registered 117.8 in April 2026 — up 3.5% from April 2025 — with through the first four months of 2026 running 2.6% ahead of the same period in 2025. ATA Chief Economist Bob Costello called Q1 2026 "the industry's strongest performance in nearly a decade."
3. The Three Structural Demand Engines
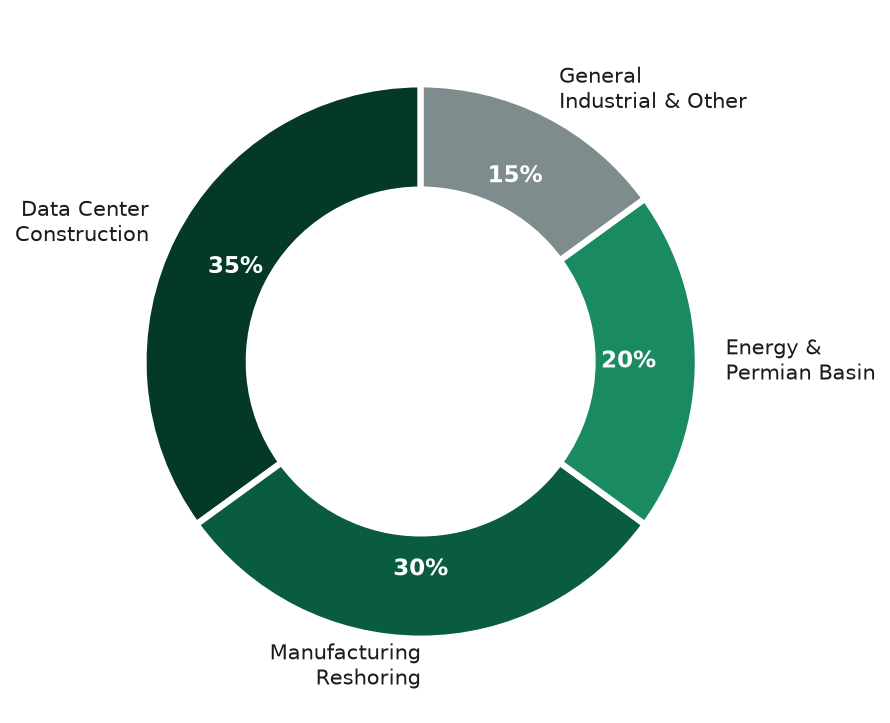
The flatbed boom is not cyclically driven by a broad consumer spending upturn. It rests on three capital-intensive, long-duration structural demand pillars that are arriving simultaneously and are geographically concentrated in the American interior.
Engine 1 Data Center Construction
Data-center construction spending exceeded $50 billion for the first time in April 2026, approximately triple its 2022 level according to Census Bureau figures. A data center is a flatbed customer before it becomes a server farm: structural steel, switchgear, power transformers, generators, and industrial cooling units all arrive on a flatbed deck — a single transformer can fill an entire trailer. Hylios data estimates a single 500-megawatt data center requires roughly 30,000 truckloads of materials, and projects are now scaling to 10-gigawatt campuses.
The geographic pull is directly into the heartland. AI-driven energy demand is concentrating investment in the American interior where abundant, low-cost energy is available. FreightWaves notes that in modern automated manufacturing and data infrastructure, energy can represent up to 38% of total production costs in sectors like steel and plastics — making the U.S. Heartland, with its energy abundance, among the most efficient places on earth to build. Examples include the Delta Gigasite in Utah targeting 10 gigawatts over the next decade. Rig Load cautions that 30–50% of planned 2026 data center capacity will slip to 2028 on power and permitting constraints — meaning flatbed demand stretches further into the future rather than vanishing.
"The 'hollowing out' of American manufacturing was real. But the data now tells a different story. Driven by technology and energy abundance, the economic winds are finally blowing inland. The Heartland is producing again, and for the first time in a generation, the center is holding." — FreightWaves
Engine 2 Manufacturing Reshoring
U.S. manufacturing construction spending exceeded $200 billion in 2024 — more than double 2019 levels — driven by tariff pressure, supply chain resilience concerns, federal incentives (IIJA, IRA, CHIPS Act), and changing cost economics. Since 2020, tracked advanced manufacturing investment has totaled $772 billion across 500+ projects nationally, with the Midwest accounting for $153 billion (19.8%) of the national total. Automotive projects alone represent 33.9% of Midwest investment versus just 18.2% nationally — led by Ohio EV battery plants, Indiana's supplier base, and Michigan's manufacturing ecosystem.
Flatbed demand is strongest during the construction phase of reshoring projects — typically 2–4 years per facility. Structural steel, precast concrete, heavy equipment, generators, HVAC units, and oversized manufacturing machinery all require flatbed or specialized transportation. A major semiconductor fabrication plant can generate 200–500 flatbed loads per month during peak construction. Eli Lilly's $27 billion domestic manufacturing plan, semiconductor fab construction in Ohio, and EV battery facilities across Indiana are all generating multi-year flatbed freight pipelines.
FreightWaves confirmed: "The U.S. infrastructure investment cycle is generating steady flatbed freight that is structural — driven by long-term federal funding commitments rather than consumer demand cycles."
Engine 3 Energy Sector & Permian Basin Activity
Oil and gas has historically been one of flatbed's most reliable demand engines — drill pipe, casing, compressors, and wellhead equipment all move on flatbeds, with every active rig generating roughly 10–15 flatbed moves per month. After a brutal pullback of 96 rigs between mid-February and mid-April 2026, the Permian Basin began recovering in May. However, the U.S. oil rig count remains down 57 rigs from a year ago, representing a structural drag on this demand engine that bears monitoring.
Grid upgrades, pipeline components, wind and solar equipment, and utility heavy industrial work continue consuming steel and driving flatbed loads in pockets across Texas, Alabama, and Gulf and Mid-South corridors. ACT Research confirmed that "flatbed rate direction will remain closely tied to energy activity, construction demand, and the pace of broader industrial recovery."
4. The Supply Side: A Market Structurally Thinned
The rate story cannot be fully understood without examining the supply side. The flatbed boom is amplified — and in some ways primarily caused — by a dramatic thinning of carrier capacity during the multi-year freight downturn of 2023–2025.
FleetOwner's 2026 Logistics Report estimates that ~89,000 carriers have exited the market since 2022, finally thinning capacity enough to firm up pricing after a "punishingly long downturn." Motor expenditures grew 1.7% in 2025 as carrier exits tightened capacity and supported recovery even as aggregate freight demand remained mixed. The 2026 freight market thus "behaves less like a single national market and more like a collection of lane-level markets, with pricing, capacity, and service reliability varying sharply by corridor."
C.H. Robinson noted that "a key driver behind these conditions remains the steady reduction in flatbed capacity over the past three years. With fewer trucks available, even modest increases in demand are having a more pronounced impact on overall market dynamics." Jansson LLC adds that regulatory pressure — safety standards, ELD compliance, and equipment requirements — limits how quickly carriers can expand, meaning this tightness is "structural, not just temporarily tight."
Carrier Atlas illustrated the supply-demand disconnect sharply: flatbed spot rates climbed to $2.89/mile while load counts simultaneously dropped 15.5% — yet year-over-year rates were still up 47%. The conclusion: thousands of carriers shut down in 2024–2025, and the trucks that survived are now in a position to hold rates.
5. Key Data Snapshot — June 2026
| Metric | Value | Context / YoY Change | Source |
|---|---|---|---|
| DAT Flatbed Spot Rate | $3.77/mile | +47–52% YoY; contract at $3.87/mile | DAT / Rig Load |
| FTR Total Spot Rate Streak | 20+ weeks | Total rates ~50% above same week 2025 | FTR Transportation Intelligence |
| ATA Tonnage Index (Apr 2026) | 117.8 | +3.5% YoY; 2026 YTD +2.6% vs. 2025 | DAT / ATA |
| Flatbed Load Posts vs. Prior Year | +60% | Strongest flatbed market since late 2022 | DAT / O Trucking |
| Flatbed Load-to-Truck Ratio (Peak) | 80+ : 1 | Midwest & Southeast most affected | C.H. Robinson |
| Midwest Share of National Load Volume | ~45% | 13-state Midwest region dominance | DAT / National Freight Connection |
| Industrial Freight Volume (YoY) | +11% | Flatbed & rail; coastal markets flat | FreightWaves SONAR |
| ISM Manufacturing PMI (May 2026) | 55.3 | Strongest since May 2022; expansion territory | Innovative Logistics Group |
| Data Center Construction Spending | $50B+ | Record; ~3x 2022 level (Census Bureau) | Census / Rig Load |
| Midwest Advanced Mfg. Investment (since 2020) | $153B | 19.8% of national $772B total | TLC Collect Research |
| Carriers Exited Market Since 2022 | ~89,000 | Primary driver of supply-side tightening | FleetOwner / 2026 Logistics Report |
6. Risk Assessment
Algorithmic cross-source risk analysis yields an aggregate MODERATE risk rating for the flatbed/heartland freight bull case. The opportunity is real and data-supported, but rests on a narrower demand base than headline rates suggest.
| Risk Factor | Severity | Potential Impact | Mitigation / Monitoring |
|---|---|---|---|
| Demand base concentration (few large projects) | High | Rate volatility if key projects pause | Monitor data center permitting slippage; Permian rig counts (Baker Hughes) |
| Seasonal Q4 softening | Moderate | Normal rate pullback post-project season | Track DAT Q4 2026 flatbed rate vs. Q4 2025 as key durability test |
| Construction backlog thinning | Moderate | Reduced nonresidential flatbed loads | Monitor ABC Construction Backlog Indicator; ABI monthly readings |
| Reshoring pace slower than announced | Moderate | 64% of ISM firms have no reshoring plans (Rig Load) | Track manufacturing construction spending (Census Bureau monthly) |
| Oil rig count structural decline | Moderate | U.S. rig count down 57 YoY — removes reliable flatbed demand engine | Weekly Baker Hughes rig count; WTI crude price as leading signal |
| Capacity re-entry / new carrier formation | Low (near-term) | Supply response could ease tightness if sustained | Track FMCSA new carrier registrations; ACT trailer orders data |
| Lane-level market fragmentation | Low | Not all corridors benefit equally; West Coast remains soft | DAT corridor-level data; Midwest vs. national divergence metrics |
7. Credible Sources for Further Research
Tier 1 — Primary Data Providers
▸ DAT Freight & Analytics — Weekly flatbed spot & contract rates, load-to-truck ratios, load posting volume. Weekly flatbed reports at dat.com/blog
▸ FTR Transportation Intelligence — Weekly Trucking Market Updates, capacity and rate forecasts. ftrintel.com
▸ ACT Research — Monthly trucking rate environment, capacity conditions, trailer orders. actresearch.net
▸ FreightWaves SONAR — Real-time freight data platform: industrial volumes, tender rejections, corridor-level data. freightwaves.com
Tier 2 — Industry Publications & Brokers
▸ C.H. Robinson Monthly Freight Market Updates — Segment-level conditions, regional breakdowns. chrobinson.com
▸ FleetOwner — 2026 Logistics Report covering capacity, regulation, market structure. fleetowner.com
▸ Carrier Atlas Freight Intelligence — Weekly rate and load data analysis. carrieratlas.com
▸ Rig Load — Flatbed-specific market analysis and DAT rate tracking. rigload.com
▸ National Freight Connection — Reshoring-driven freight flow analysis. nationalfreightconnection.com
Tier 3 — Economic & Government Data
▸ ATA Trucking Tonnage Index — Monthly tonnage data (American Trucking Associations). Released ~3–4 weeks after month-end.
▸ ISM Manufacturing PMI — Monthly manufacturing activity; leading indicator for flatbed demand in metals, machinery & construction inputs.
▸ Baker Hughes Rig Count — Weekly oil & gas rig count; leading indicator for energy-sector flatbed demand.
▸ U.S. Census Bureau Construction Spending — Tracks data center, manufacturing, and residential construction. Monthly release.
▸ Deloitte 2025 Engineering & Construction Outlook — Structural analysis of federal investment (IIJA, IRA, CHIPS Act) on construction demand.
Conclusion & Outlook
The flatbed freight market in the American heartland is not experiencing a cyclical upturn — it is in the early stages of a structural reshaping of the U.S. industrial economy. Three powerful demand engines (AI data center construction, manufacturing reshoring, and energy infrastructure) are simultaneously pulling on a flatbed capacity base that was dramatically thinned by three years of carrier exits. The convergence is producing historically extreme rates and load-to-truck ratios, concentrated in Midwest and Southern industrial corridors.
Data from DAT, FTR, SONAR, ACT Research, and C.H. Robinson all converge on the same conclusion: flatbed is the most structurally supported segment of the U.S. freight market heading into the second half of 2026. The primary risk is that the demand base is narrower than the rate line suggests — concentrated in a short list of capital-heavy projects — and seasonal Q4 softening remains the natural test of whether structural durability holds.
For asset managers and investors tracking transportation infrastructure, industrial real estate, and Midwest economic activity, the freight data provides a powerful real-time signal: the center of the country is producing again, and the flatbed market is its most direct financial expression.
References
| No. | Source | Publication / Platform | Date |
|---|---|---|---|
| [1] | Craig Fuller, "The Heartland's Revenge: How AI Is Reindustrializing the American Interior," FreightWaves. Available: freightwaves.com | FreightWaves | May 4, 2026 |
| [2] | "Freight Data Indicate Early US Industrial Rebound as Midwest Truck Volumes Jump," USNN World News. Available: usnn.news | USNN World News | Feb. 10, 2026 |
| [3] | "North America Truckload Freight Market Update — April 2026," C.H. Robinson Insights. Available: chrobinson.com | C.H. Robinson | Jun. 22, 2026 |
| [4] | "Reshoring Is Rewriting Freight Demand. Here Is Where the Loads Are Actually Coming From," National Freight Connection. Available: nationalfreightconnection.com | National Freight Connection | Apr. 21, 2026 |
| [5] | "Midwest Truckload Market Tightness Persists Amid National Freight Shift," IndexBox Market Intelligence. Available: indexbox.io | IndexBox | Mar. 1, 2026 |
| [6] | "1Q26 Midwest Manufacturing Research Report," TLC Collect Research. Available: tlcollect.com | TLC Collect | Q1 2026 |
| [7] | "Flatbed Report: Tonnage Holds Firm; What the ATA's April Reading Means for Flatbed Carriers," DAT Freight & Analytics Blog. Available: dat.com/blog | DAT Freight & Analytics | Jun. 2, 2026 |
| [8] | "Truck Freight Rates — May 2026 Update & Trends," ACT Research. Available: actresearch.net | ACT Research | May 26, 2026 |
| [9] | "Flatbed Report: The Construction Boom That Fueled Flatbed Is Fading," DAT Freight & Analytics Blog. Available: dat.com/blog | DAT Freight & Analytics | Mar. 24, 2026 |
| [10] | Rig Load Staff, "Flatbed Freight Rates 2026: Booming on a Narrow Base," Rig Load. Available: rigload.com | Rig Load | Jun. 6, 2026 |
| [11] | "Flatbed Spot Rates Hit $2.89/Mile, New Record, as Loads Drop 15.5%," Carrier Atlas Freight Intelligence. Available: carrieratlas.com | Carrier Atlas | Jun. 10, 2026 |
| [12] | "Dry Van and Refrigerated Spot Rates Decline While Flatbed Freight Rates Increase Across Trucking Markets," FleetOwner. Available: fleetowner.com | FleetOwner | Jun. 19, 2026 |
| [13] | "2026 Logistics Report Highlights Capacity Squeeze, Regulation, and AI Adoption in Trucking," FleetOwner. Available: fleetowner.com | FleetOwner | Jun. 19, 2026 |
| [14] | "Flatbed Report: Permian Rigs Are Back. So Are Flatbed Demand and Spot Rates," DAT Freight & Analytics Blog. Available: dat.com/blog | DAT Freight & Analytics | May 26, 2026 |
| [15] | "Why Flatbed Trucking Capacity 2026 Demands a New Strategy," Jansson LLC Logbook. Available: janssonllc.com | Jansson LLC | Mar. 30, 2026 |
| [16] | "Is Flatbed Signaling a Manufacturing Renaissance?" FreightWaves. Available: freightwaves.com | FreightWaves | Feb. 22, 2026 |
| [17] | "What Lumber and Steel Futures Are Telling Flatbedders As We Wrap Up 2025," FreightWaves. Available: freightwaves.com | FreightWaves | Oct. 27, 2025 |
| [18] | "2025 Engineering and Construction Industry Outlook," Deloitte Insights. Available: deloitte.com/us/en/insights | Deloitte Insights | Nov. 3, 2024 |
| [19] | "Key Takeaways from FTR's Latest Trucking Market Update," FTR Transportation Intelligence. Available: ftrintel.com | FTR Transportation Intelligence | Jun. 10, 2026 |
| [20] | "Flatbed Report: Trucking Tonnage Hits New Milestone; Is the Freight Recession Officially Over?" DAT Freight & Analytics Blog. Available: dat.com/blog | DAT Freight & Analytics | May 5, 2026 |
| [21] | "Flatbed Report: Sand, Stone, and the Flatbed Bounce," DAT Freight & Analytics Blog. Available: dat.com/blog | DAT Freight & Analytics | Apr. 14, 2026 |
| [22] | "Spot Market Trends 2026: Rates, Capacity & Outlook," O Trucking. Available: otrucking.com | O Trucking | Feb. 19, 2026 |
| [23] | "Pharma, Food, Flatbed, and Automotive: The Four Re-Shoring Freight Lanes Small Carriers Can Actually Win," FreightWaves. Available: freightwaves.com | FreightWaves | May 13, 2026 |
| [24] | "Manufacturing Reshoring: How Bringing Jobs Back Creates Trucking Demand," USA Trucker Choice. Available: usatruckerchoice.com | USA Trucker Choice | Mar. 23, 2026 |
| [25] | "The Manufacturing Comeback Is Real. Here's What It Means for Your Business," RJ Logistics. Available: rjlogistics.com | RJ Logistics | Jun. 11, 2026 |
| [26] | "AI Data Centers Trigger Historic Reshoring Wave in American Heartland," Hylios Intelligence. Available: hylios.com | Hylios | May 4, 2026 |
| [27] | "Flatbed Spot Rates Near Record at $2.69/Mile: How the Data Center Construction Boom Is Rewriting the Freight Market," Innovative Logistics Group. Available: innovativelogisticsgroup.io | Innovative Logistics Group | May 25, 2026 |
| [28] | "DAT Freight Focus: Truckload Freight Trends and Market Outlook for 2026," DAT Freight & Analytics Resource Center. Available: dat.com/resources/freight-focus-report | DAT Freight & Analytics | Dec. 8, 2025 |
| [29] | "Rail Industry Overview — June 2026," Association of American Railroads. Available: aar.org | AAR | Jun. 5, 2026 |
| [30] | "North America Truckload Freight Market Update — August 2025," C.H. Robinson Insights. Available: chrobinson.com | C.H. Robinson | Jun. 18, 2026 |
All sources accessed June 23, 2026. Citation IDs correspond to inline 【】 markers throughout the memo body.
Important Disclosures & Disclaimers
This research memorandum is provided for informational purposes only and does not constitute investment advice, an offer to sell, or a solicitation to buy any securities. The analysis herein is based on publicly available information from third-party industry sources including DAT Freight & Analytics, FTR Transportation Intelligence, FreightWaves, C.H. Robinson, ACT Research, FleetOwner, and others cited throughout. SkyWise Research does not independently verify third-party data and makes no representations as to its accuracy or completeness.
All investments involve risk. Past performance and historical freight data are not indicative of future results. This report is intended for institutional and professional use only. Readers should conduct their own due diligence before making any investment or business decisions based on this analysis.
Analyst Note: This thematic research memo was compiled on June 23, 2026. Market conditions in freight are highly dynamic; data points cited reflect the most recent available publications as of the report date. Readers are encouraged to monitor cited primary sources for updated weekly and monthly readings.
Frequently Asked Questions
What is driving the flatbed freight boom in America's heartland?
The flatbed freight boom is driven by reindustrialization in America's interior, including manufacturing reshoring, infrastructure investment, energy sector growth, and construction activity. These trends are creating sustained demand for flatbed trucking services across the heartland.
How does reindustrialization affect the transportation sector?
Reindustrialization increases demand for industrial freight transportation, particularly flatbed trucking which serves manufacturing, construction, and energy sectors. This creates investment opportunities in transportation companies, logistics infrastructure, and related supply chain businesses.
What are the investment implications of the heartland freight renaissance?
The heartland freight renaissance presents investment opportunities in flatbed carriers, logistics companies, transportation infrastructure, and industrial real estate. Investors should consider companies with strong heartland exposure, modern fleet capabilities, and capacity to capture growing industrial freight demand.
Published Jun 23, 2026 and not updated since. Personal views, not investment advice. See Disclosures.